

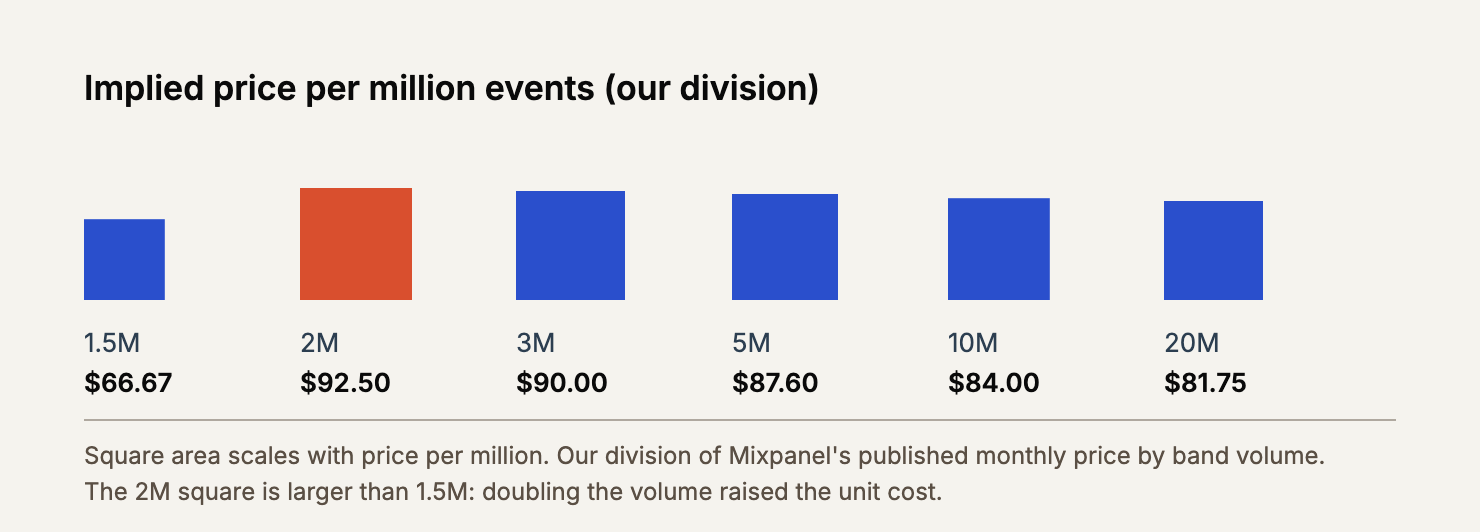
$92.50 per million events at 2 million a month, and $66.67 at 1.5 million. Buy more, pay more per unit. That is on the pricing page.
Somewhere in Mixpanel's published rate card there is a step that goes the wrong way.
At 1.5 million events a month the Growth plan is $100, which works out at $66.67 for every million events. Move up to 2 million and it is $185, which is $92.50 a million.
Thirty-nine percent more per million, for carrying more of them, because 2 million is where the entry rate gives way to the next tier.
Mixpanel does not print a warning about this. It is simply what the numbers do, and every figure in this piece comes from the capture I published, which carries the vendor page hashes so you can argue with a specific row rather than with me.
I have priced a lot of analytics tools and the reflex is always to look for the cheapest plan that covers today. In this category that reflex gets you a surprise in month nine.
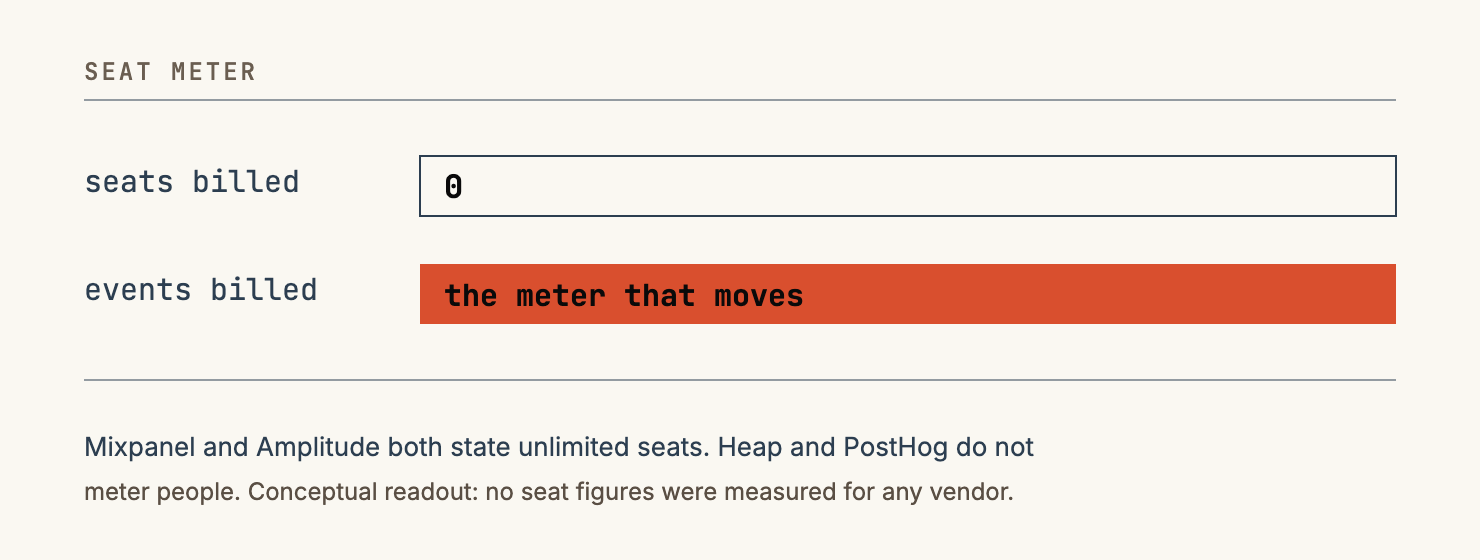
The reason is one sentence into the census: none of these four bills for the people who use the product.
Start with the fact that ruins your usual lever
Seats are how most software punishes growth, so cutting licences is how most buyers save a quarter. It does nothing here.
Mixpanel gives unlimited seats on its free plan. Amplitude says every plan includes unlimited seats.
PostHog and Heap do not raise the subject as a meter at all.
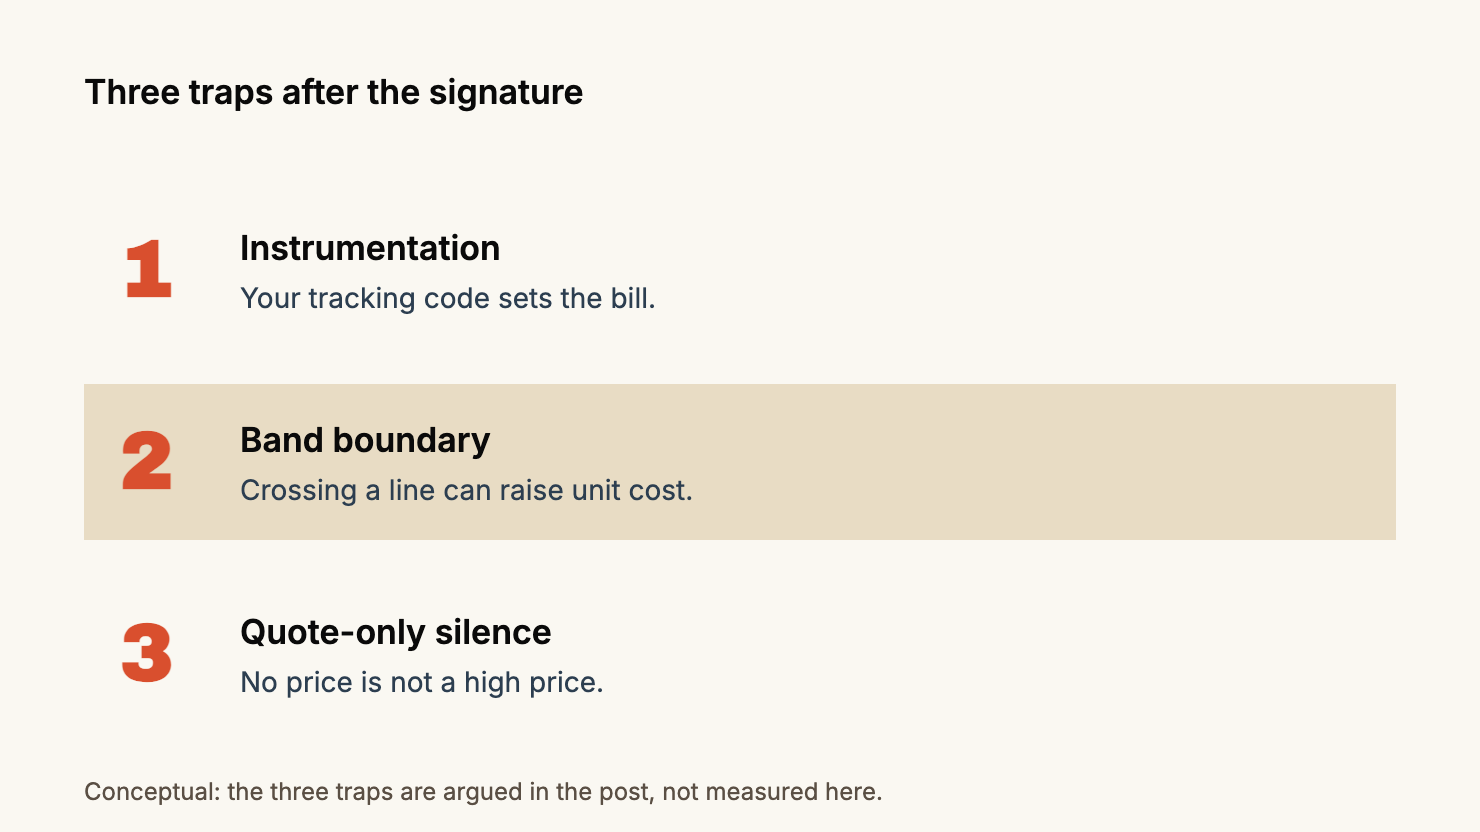
What moves the bill is the events you send, which means the person who actually controls your analytics budget is whoever writes the tracking code.
Two companies with the same headcount can land four times apart. Neither was gouged. One had a naming convention and a rule about what deserves an event.
Mixpanel is the only one with a number on the door
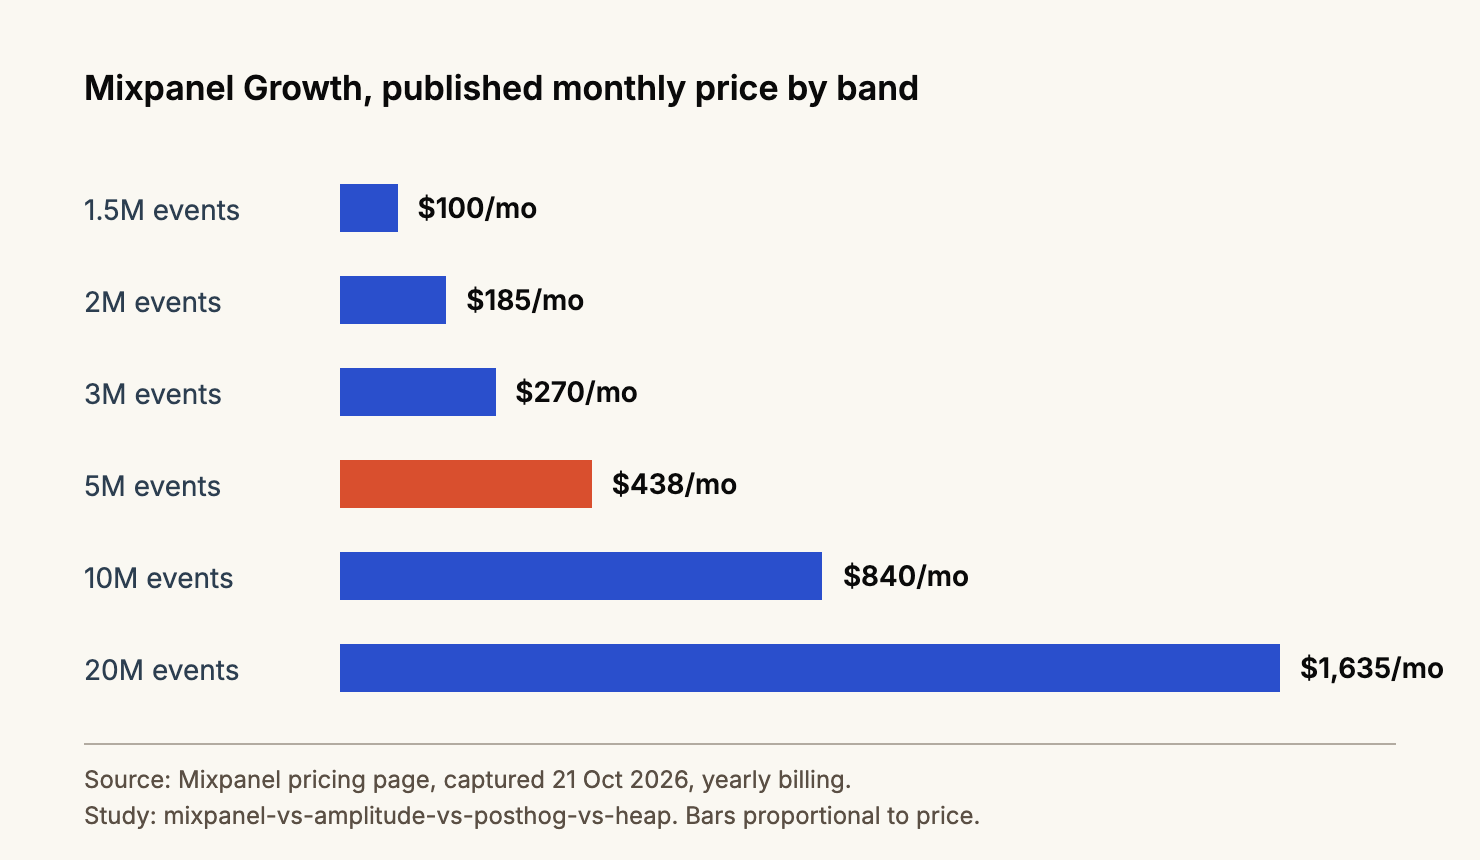
Its Growth plan is published by event band on yearly billing. $100 at 1.5 million, $185 at 2 million, $270 at 3 million.
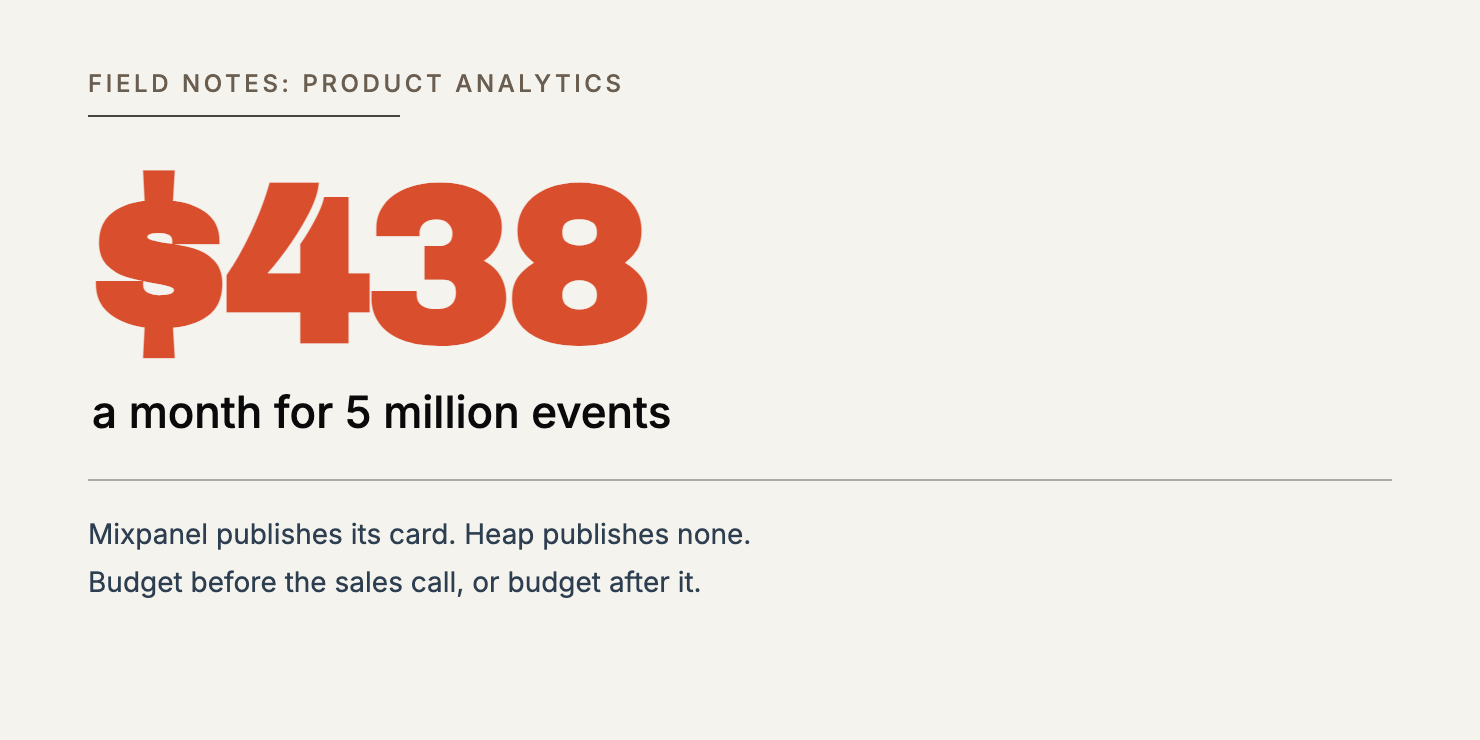
Then $438 at five million, $840 at ten, and $1,635 at twenty.
The free plan runs to a million events a month with unlimited seats, so a small team starts on a published card without taking a call.
In a category where three competitors cannot manage that, it is the whole story.
The page also prints the annual saving against monthly billing, $2,100 at the five-million band. Read it carefully before it reaches a forecast.
Add the saving back onto the annual total of $5,256 and you get what twelve months would have cost paying monthly, a figure Mixpanel does not print anywhere. Ask for it in writing.
Now follow one team through a year
This is an invented team, not a client. Forty people, B2B SaaS, a web app and two mobile apps, currently sending about 1.1 million events a month because the mobile instrumentation is thin.
They pick Mixpanel because it is the only vendor that answered the budget question by email. At their current volume they sit in the free band, which feels like a triumph and lasts eleven weeks.
Then a product analyst, correctly, starts tracking the things that matter. Cohort events, in-app messaging impressions, backend events from the billing service.
The count goes to 2.4 million before anybody in finance has heard a number.
At 2.4 million they are in the 3 million band at $270 a month, and their unit cost has risen from where they started.
Neither vendor overcharged them. They bought a meter and then fed it.
The lesson is not that Mixpanel is expensive.
It is that in this category the forecast is an engineering document before it is a finance one, and the two get written by different people six months apart.
Where that forecast breaks
Take twelve months out rather than today.
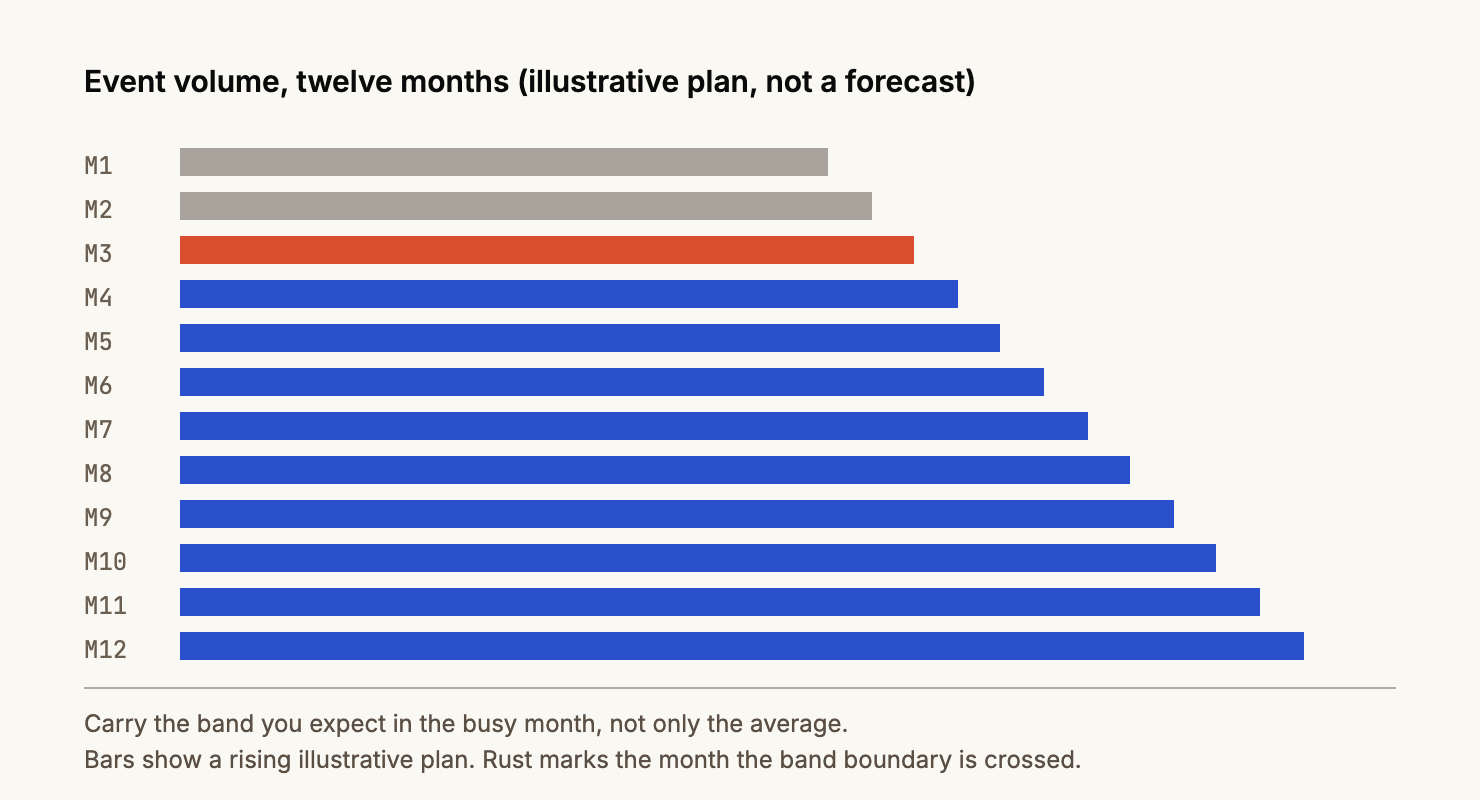
Add the backend and mobile events that get forgotten in the meeting, because they start counting the day tracking goes live and the plan never gets rescoped.
For a team landing at 3 million events a month, the card reads $270 a month and $3,240 a year. Give finance that as a range, the expected band and the one above it, and the awkward conversation happens in the planning meeting rather than in the renewal one.
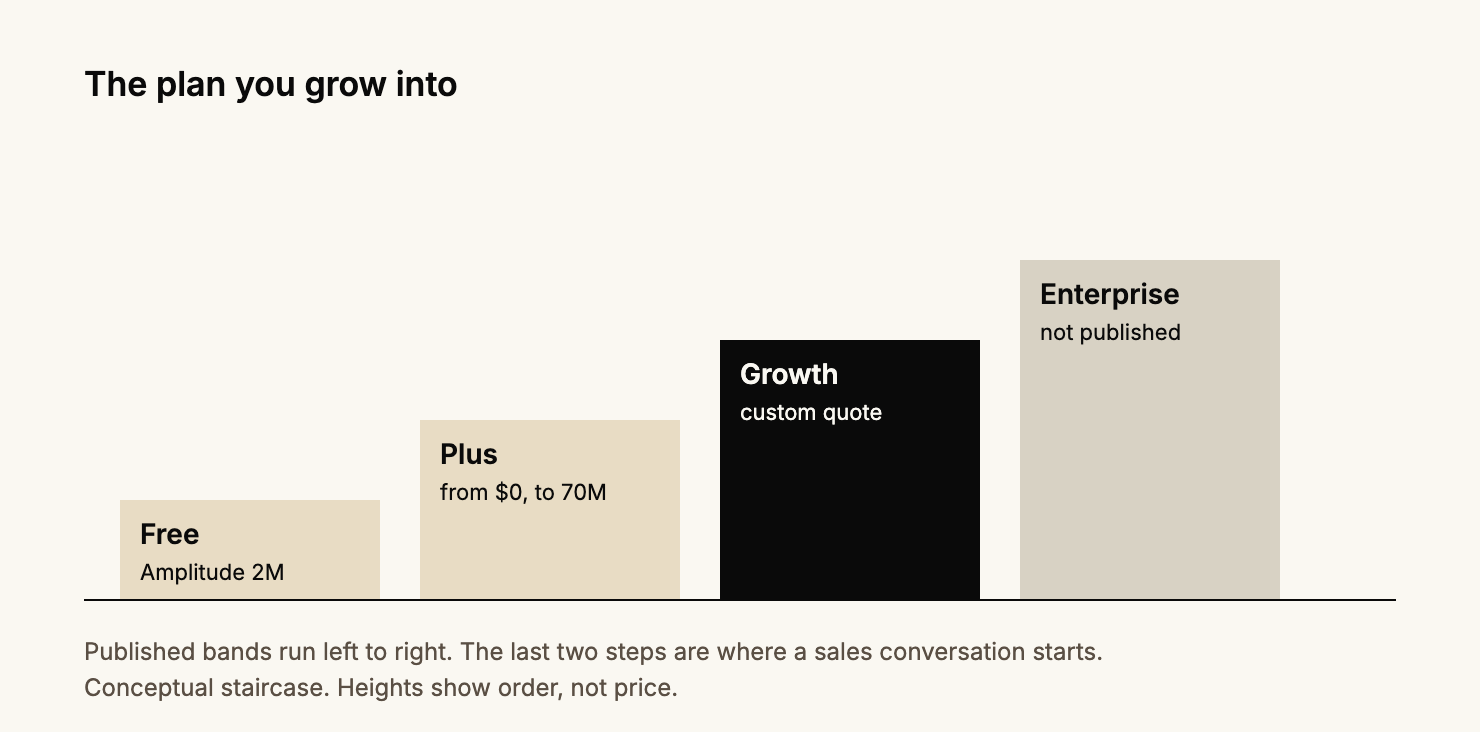
Then ask the question that costs nothing: what does the band above our forecast cost? Mixpanel's card stops at 20 million events and sends you into a conversation. Amplitude's published ceiling is 70 million events on Plus. A budget that survives an average month can still fall over in a busy one.
Amplitude and Heap will quote you the only plan that matters
Amplitude is more open than its reputation. Free gives you 2 million events a month indefinitely, and Plus starts at $0 with published headroom to 70 million.
Above that, Growth is labelled custom and event based.
Labelling the edge honestly beats inventing a plausible number, and I would rather buy from a vendor who marks where the page stops. It still leaves you with nothing for the plan a mid-market team ends up on.
Heap has the same problem with less grace. Four tiers, Free, Growth, Pro and Premier, and custom session pricing where the figures should be.
If you need a Heap number before a call, the page will not help you and neither will any third-party table.
PostHog's price lives in a widget you have to drive
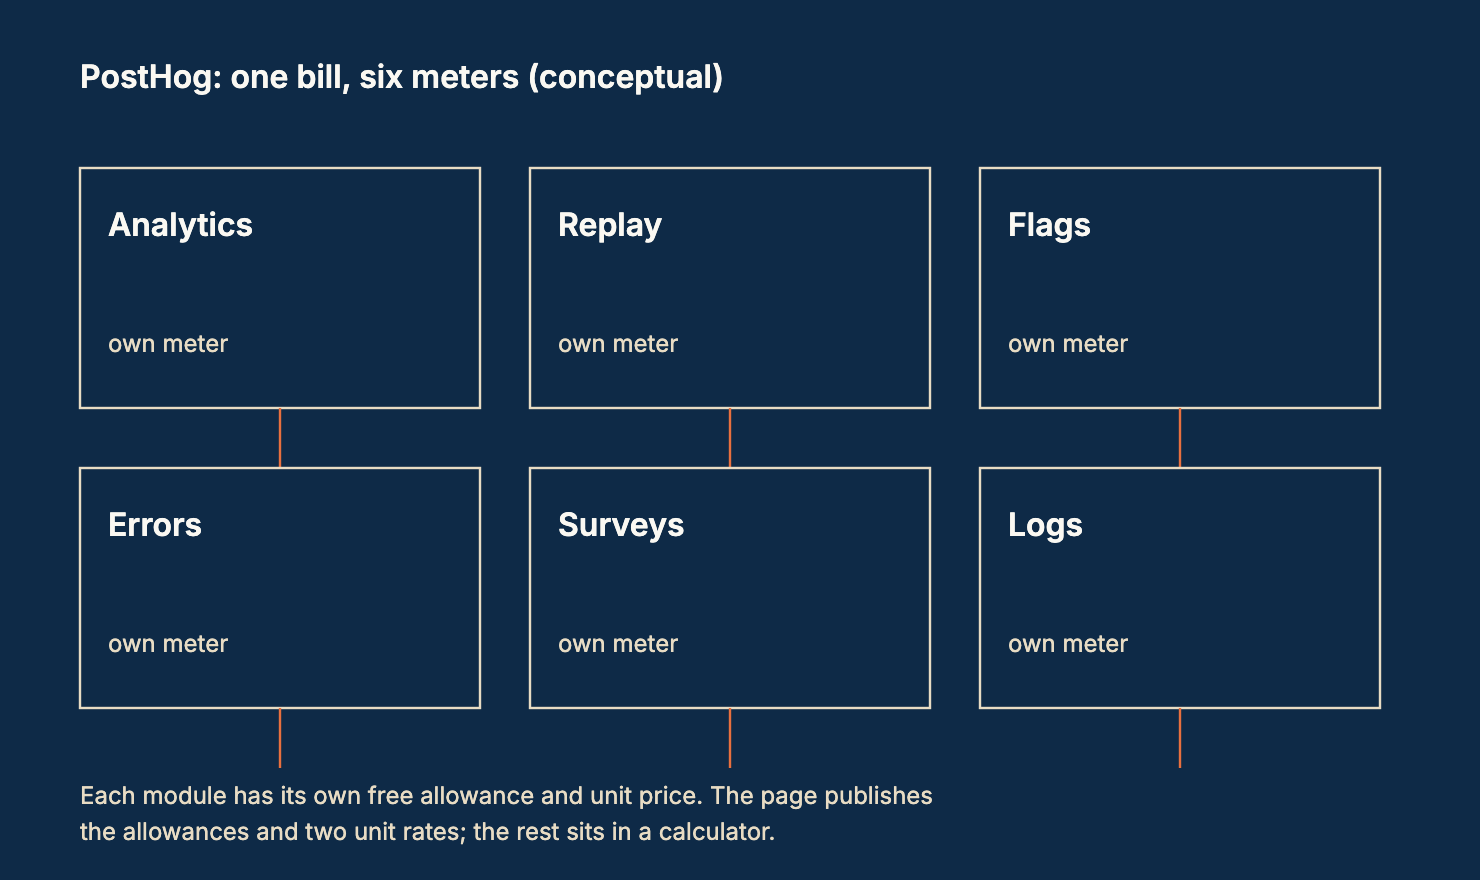
PostHog bills every product on its own meter, so the number is a sum rather than a plan. A million analytics events a month free. Five cents per gigabyte for log retention past the default window.
Eighty dollars buys thirty minutes with someone who knows the product, and support moves from email to Slack above $2k a month.
Then it hands you a calculator that opens at $0 across seven products. Accurate, and useless as a comparison point, because the per-product rates live inside the widget rather than in the page text.
If your team is engineering-led and will own the invoice, that is a coherent design and I will defend it. If you are the person who has to put a figure in front of finance on Thursday, it is a wall with a slider on it.
Run the calculator if you must. Screenshot it, write the date on the screenshot, and tell your finance partner exactly what it is. A colleague cannot reproduce that number from the page, and in three months neither will you.
Two of them will hand you a year, if you read the conditions
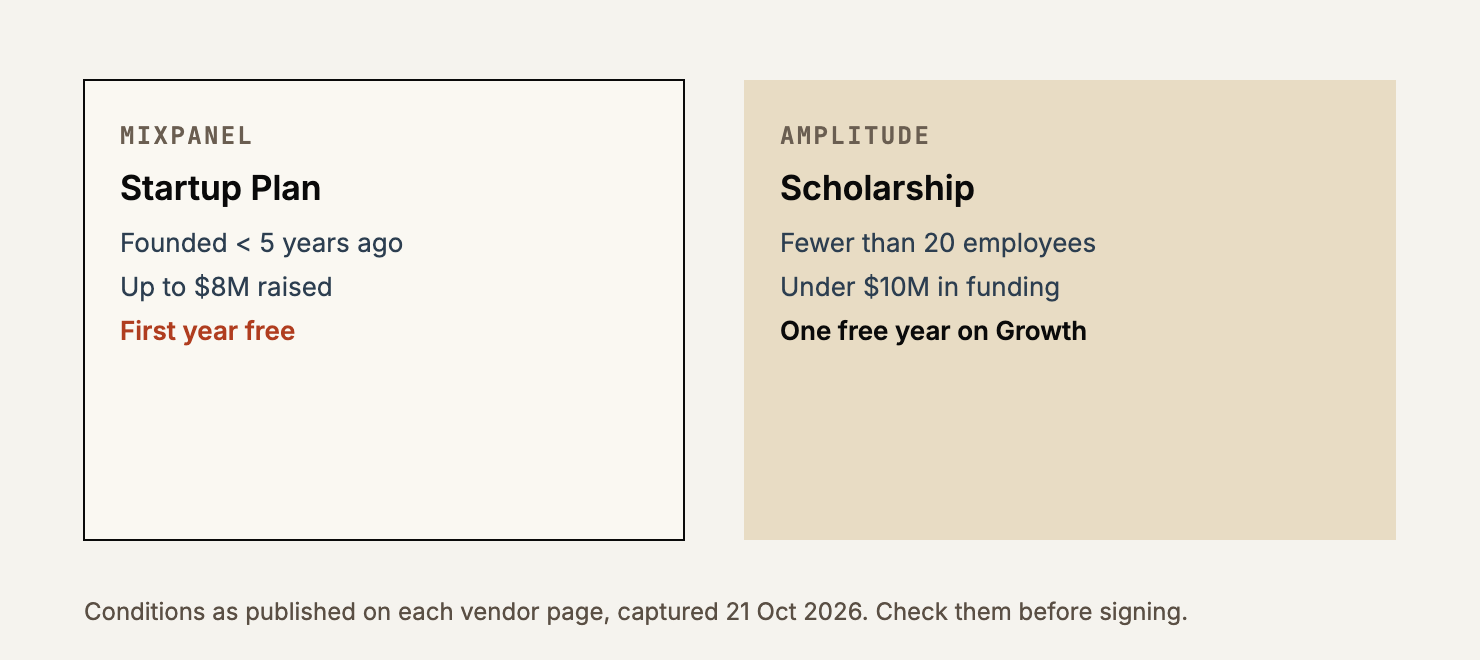
Mixpanel's startup programme gives a first year free to companies founded in the last five years with up to $8 million raised.
Amplitude's scholarship gives one free year on Growth to companies under 20 employees with under $10 million in funding.
Both sets of conditions are printed by the vendors, which is the only reason I trust them. Both are plans you enter at the start rather than discounts you argue for later.
A team that signs a paid annual contract in January and finds out about the free year in March has bought itself an education.
What to send all four on Monday
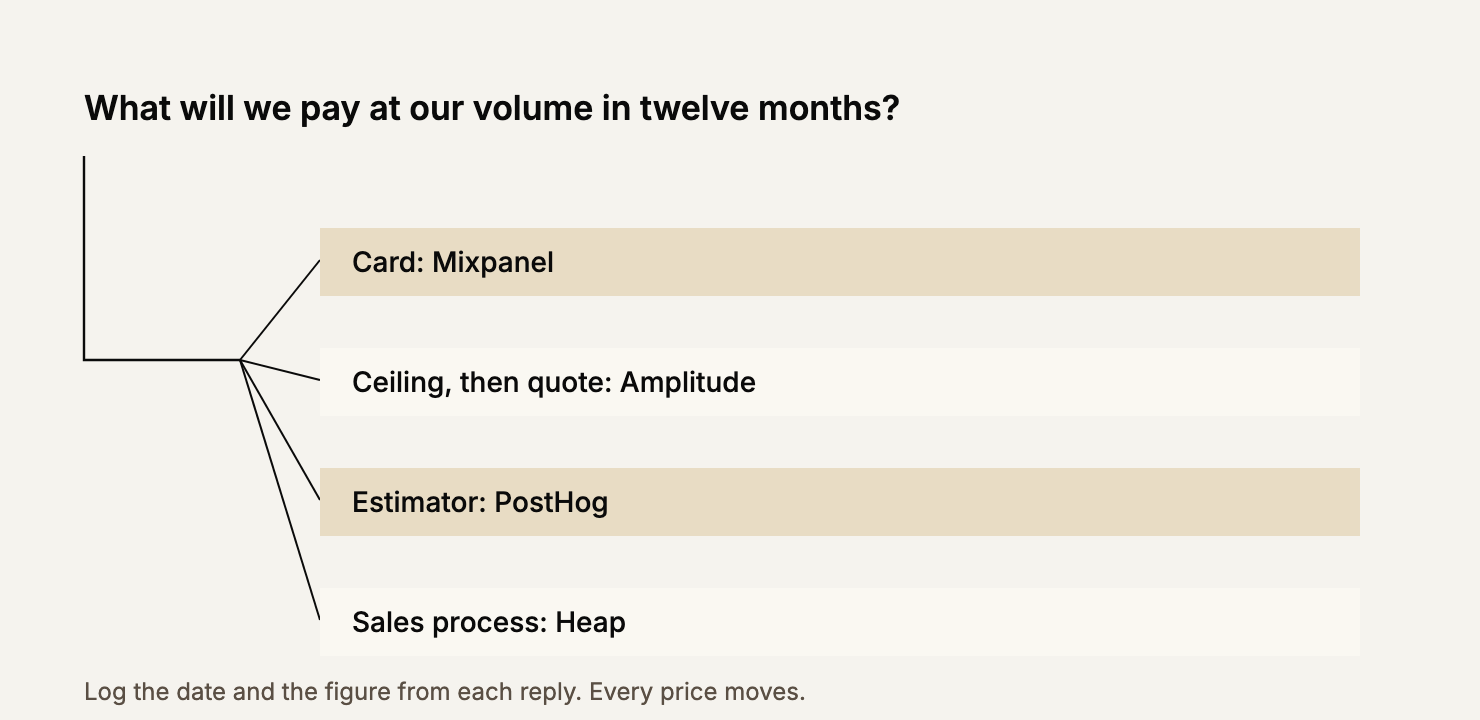
One question, copy-pasted: what will we pay at our volume in twelve months?
Mixpanel answers from the card. Amplitude answers to its ceiling and then quotes. PostHog makes you drive the calculator. Heap sends a calendar link.
Only one answers without a form, and only up to the top of its card. Date every reply, because all four of these prices move and a March quote is not a September quote.
The second question is the one that catches teams out: what happens at the boundary above our forecast. Ask it in the same email.
When the honest answer is none of them
Product analytics earns its keep when a decision changes because of it. Which onboarding step to fix, which cohort to chase, which feature to kill.
Name the decision and the tool choice gets easy.
Name nothing and you have bought a dashboard the team opens for six weeks and then stops mentioning.
It will renew anyway, because cancelling takes a meeting and the meeting keeps sliding.
If your volume is genuinely small, a warehouse and a SQL habit answer most of the same questions for a fraction of the meter.
These tools earn their place on behavioural depth, cohort work and replay, not on counting.
And if the tracking code was never written, no price list will save you. Instrument the product, then price the tool that reads it.
Four readers, four first moves
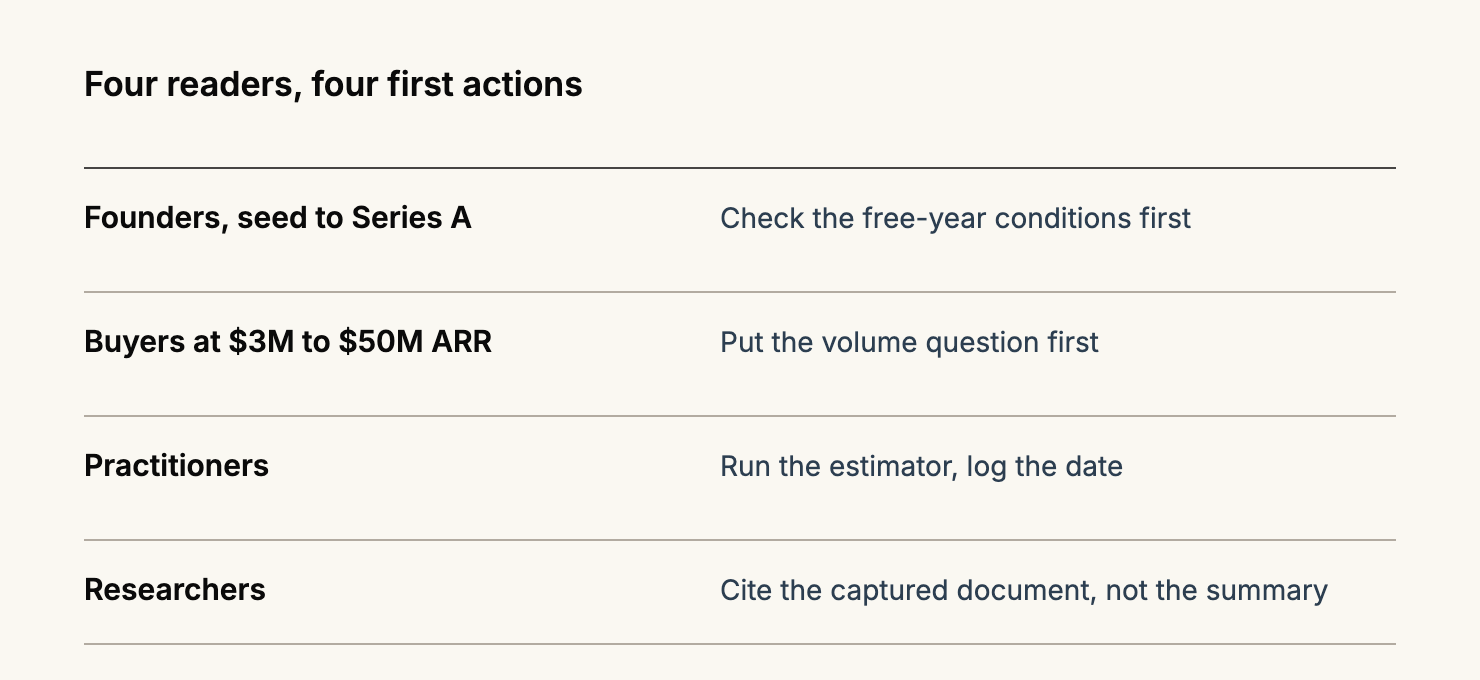
A founder at seed or Series A should read the two startup programmes before anyone signs. Conditions first, headline second.
Whoever runs marketing or operations between three and fifty million in revenue should put the volume question at the top of every conversation. It picks the band, the band picks the budget, and one vendor will read you the price.
The person running the evaluation should run PostHog's calculator, screenshot it and date it. It is a real quote in every sense except reproducibility.
And if you are a journalist or an analyst, the citable object is the census table: one vendor of four publishes a rate card and none of them prices by seat.
What we did not check
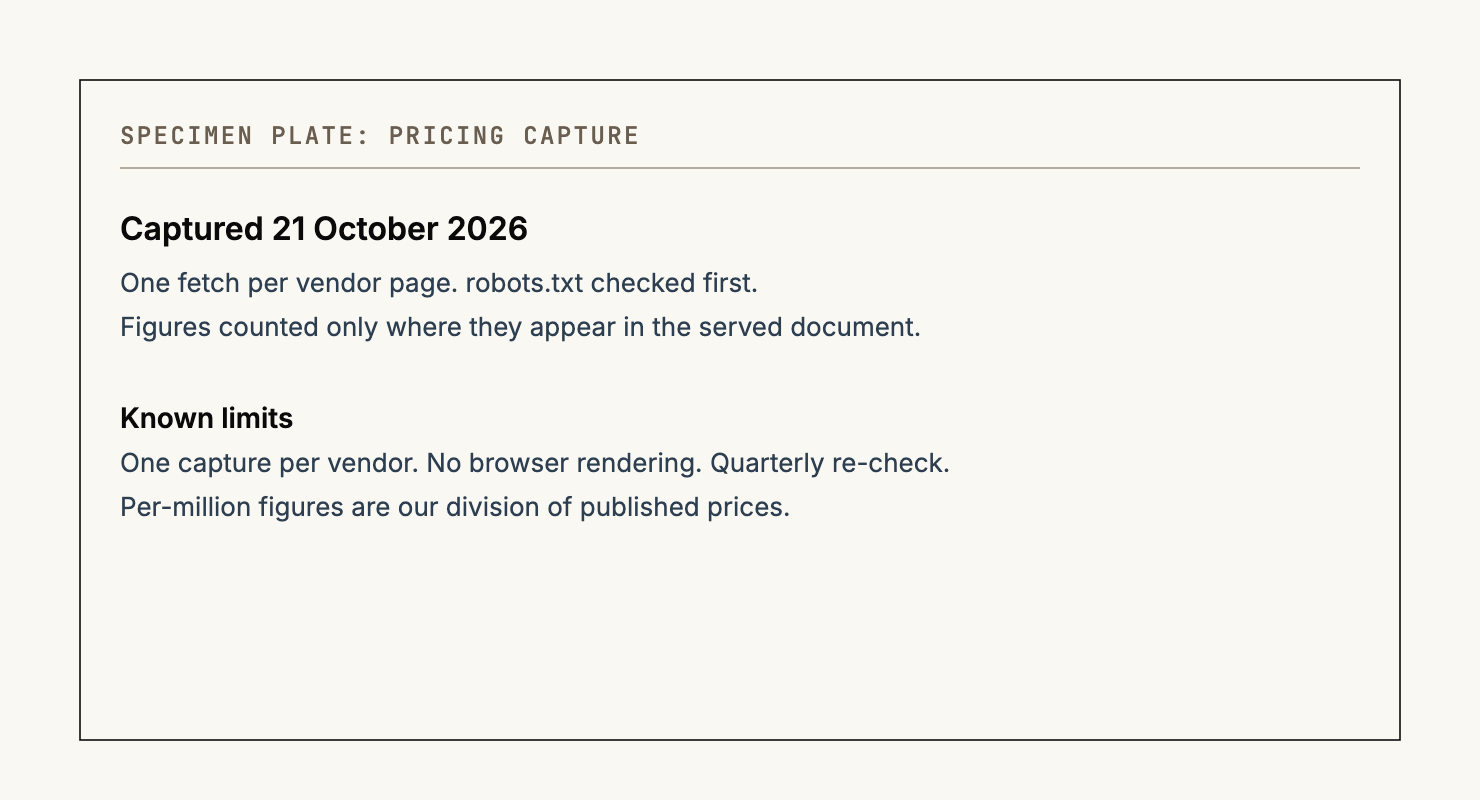
One capture per vendor on 21 October 2026, and the study is re-checked quarterly because these prices move.
I read what the server sent rather than what a browser assembles, so anything rendered by JavaScript is recorded as absent. Which is why PostHog turns up with allowances and no plan price.
The per-million column is my division of published monthly prices by band volume, not a vendor claim. The $2,100 saving is Mixpanel's own figure and the monthly price behind it is not printed on the page I captured.
At real mid-market volume the numbers on any card open a negotiation rather than closing one.
Wrap-up
Seats decide nothing here. Your instrumentation decides everything, and the trap in the middle of the rate card is only surprising if you assumed volume discounts get better per unit as you buy more.
Use the card where there is one, put the same two questions to the rest in one email, and read the startup conditions before anybody signs.
If you want to know whether your own pricing page answers the question a finance partner asks, run the scanner over it.