

Half of the B2B software market will not tell you what it costs. The other half charges in a unit most buyers will not guess.
We checked the live pricing pages of 479 B2B software companies drawn from the Y Combinator open dataset in October.
Two hundred and thirty-four of them published a price. That is 48.9%.
Just under half. Which means the odds that a well-informed buyer can price your product without speaking to somebody are slightly worse than a coin toss.
Just under half.
The remaining 51% did one of three things. A hundred and fifteen sent the visitor to sales. Forty had a pricing page with no numbers on it. Ninety had no pricing page we could find at all.
This usually gets reported as a transparency problem, and it is one. The more useful reading is that the pricing page has stopped being a fact sheet. It is the first step of a sales conversation.
Which means the buyer arrives at your comparison page, or your competitor's, holding no number for you at all.
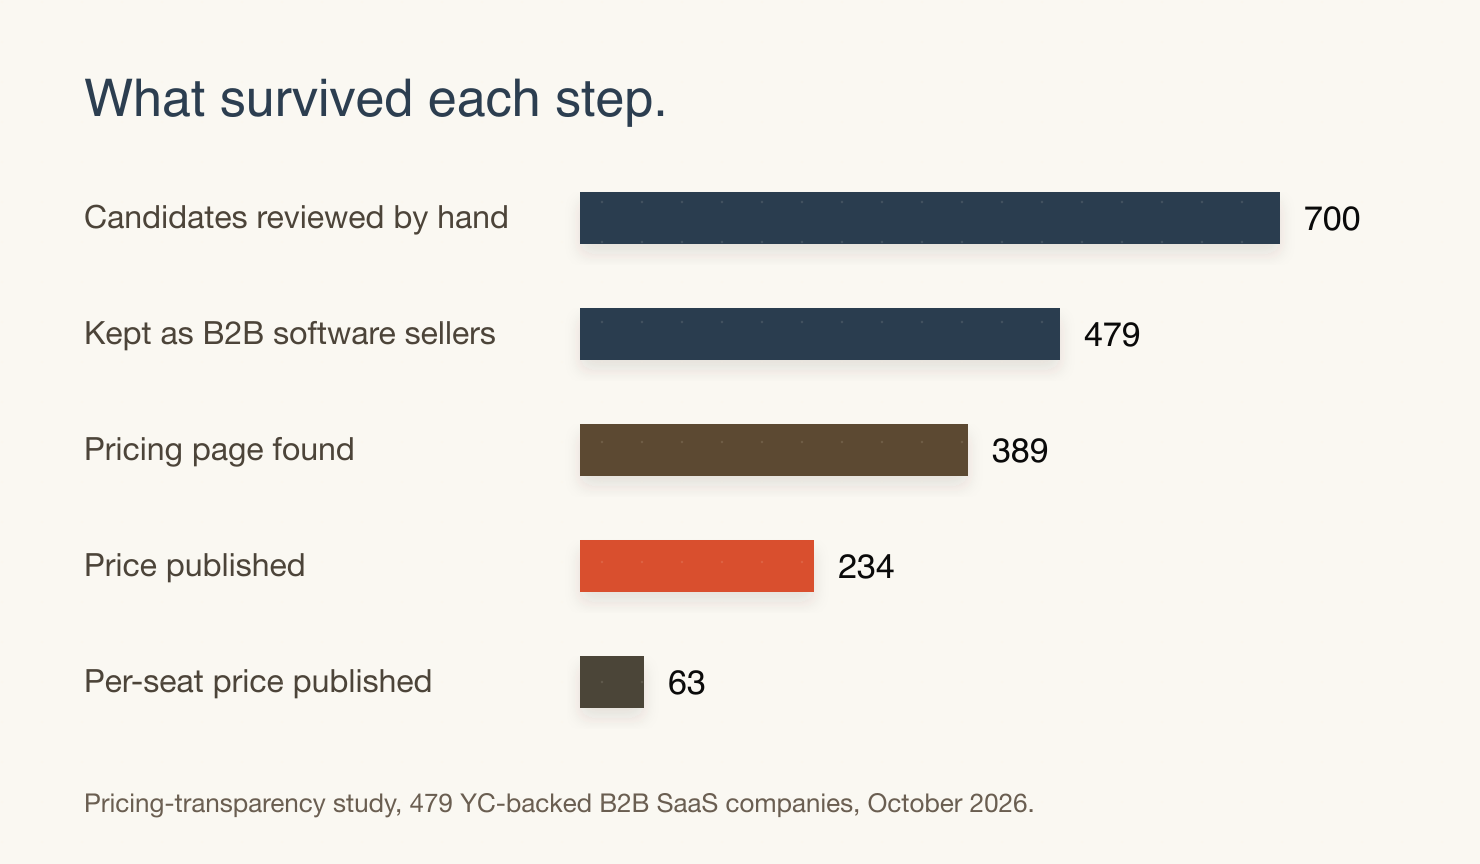
The funnel is where the story gets honest
We reviewed the first 700 candidates by hand, reading each homepage's title, description and opening text, and kept the 479 that sell software to businesses.
From there we looked for a pricing page. We found one at 389 of the 479.
From those 389, a published price at 234.
And of those 234, a published per-seat price at 63.
Seven hundred. Four hundred and seventy-nine. Three hundred and eighty-nine. Two hundred and thirty-four. Sixty-three.
Each step is a real narrowing. Each one is a place where a buyer silently loses the ability to compare you without talking to somebody.
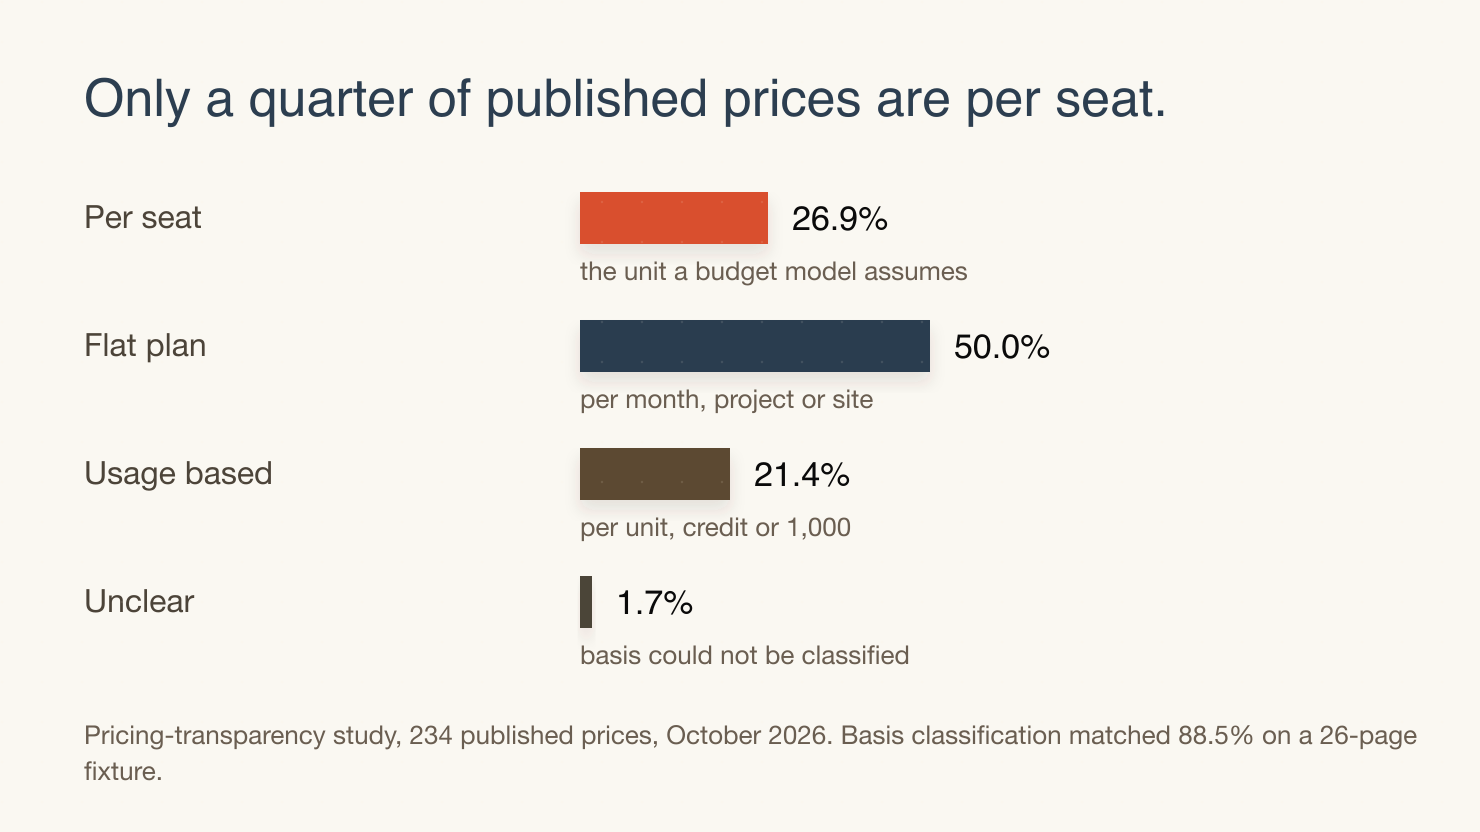
Only a quarter of published prices are per seat
Here is the number I would put in front of a finance team before they model your product for a prospect.
Of the 234 companies that published a price, 26.9% published a per-seat price. Half published a flat monthly figure. Twenty-one point four percent published usage-based pricing.
Seventy-three percent of published prices are not per seat.
Nearly three in four.
Budgets are built in seats. Procurement teams default to seats because seats are the unit they can allocate across departments. If your product is priced per credit, per contact, per site or per thousand units, and your page does not say so, somebody will build a model that is wrong by a wide margin. They will not come back and ask. You will simply learn you were never in the budget.
It takes one sentence to prevent this. "Priced per active contact, not per seat" costs nothing and removes an entire category of late objection.
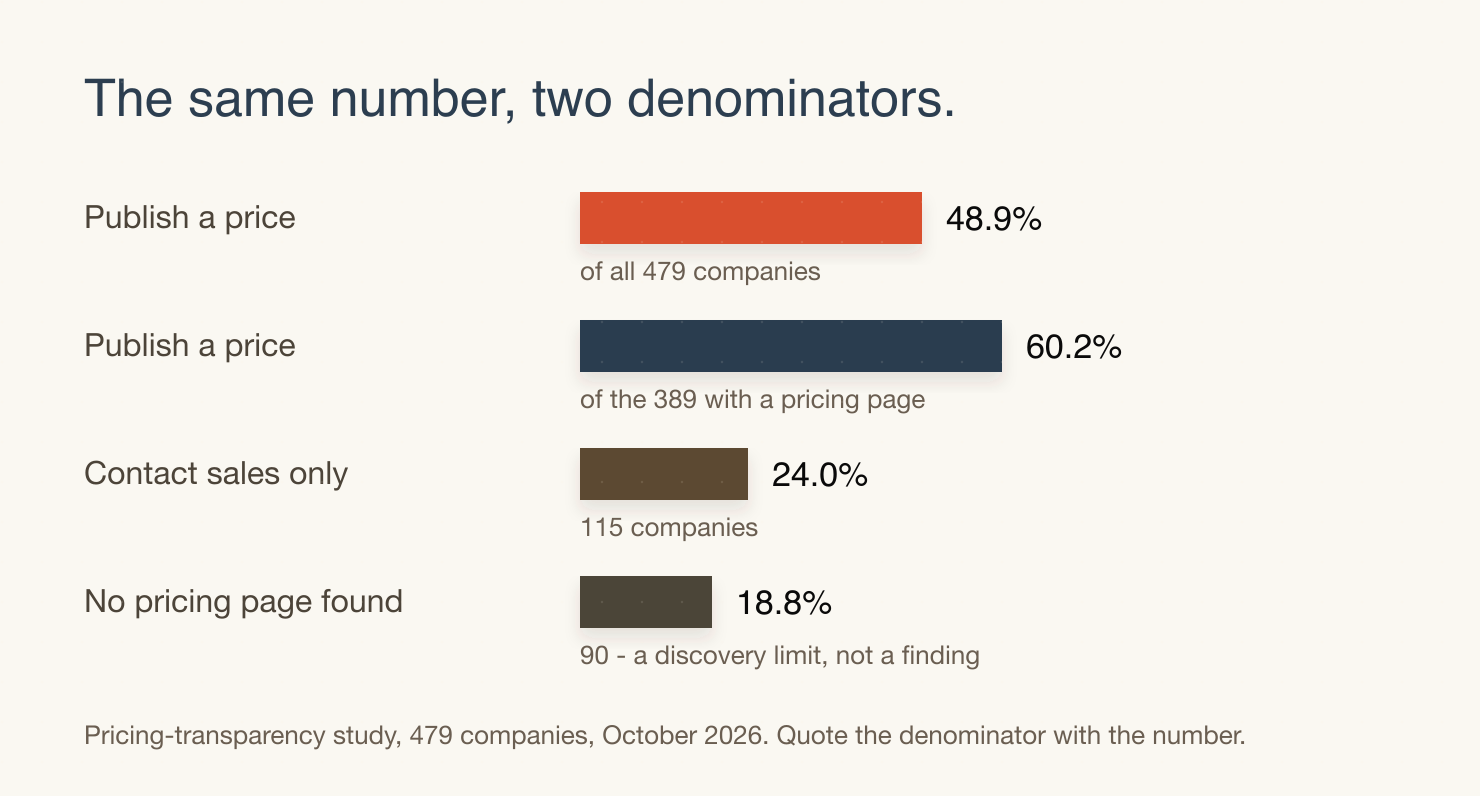
Sixty percent of the ones who publish anything at all
The 49% headline is the honest one, because it counts all 479, including the ninety companies whose pricing page we never found.
But that 90 is a discovery limit, not a finding. We are not saying those ninety companies hide their prices. We are saying our crawler could not reach a pricing page.
So here is the second framing. Excluding the ninety, 60.2% of companies with a findable pricing page publish a number.
Be honest about the limits of that adjustment, though. Excluding unreachable pages makes the number better, not definitive. The ninety are not a random sample of vendors who hide prices. They are a sample of vendors whose pages our crawler could not reach, and that tracks technical choices rather than pricing strategy.
Both numbers are defensible. Quote the one that matches your argument, and state which denominator you are using when you do.
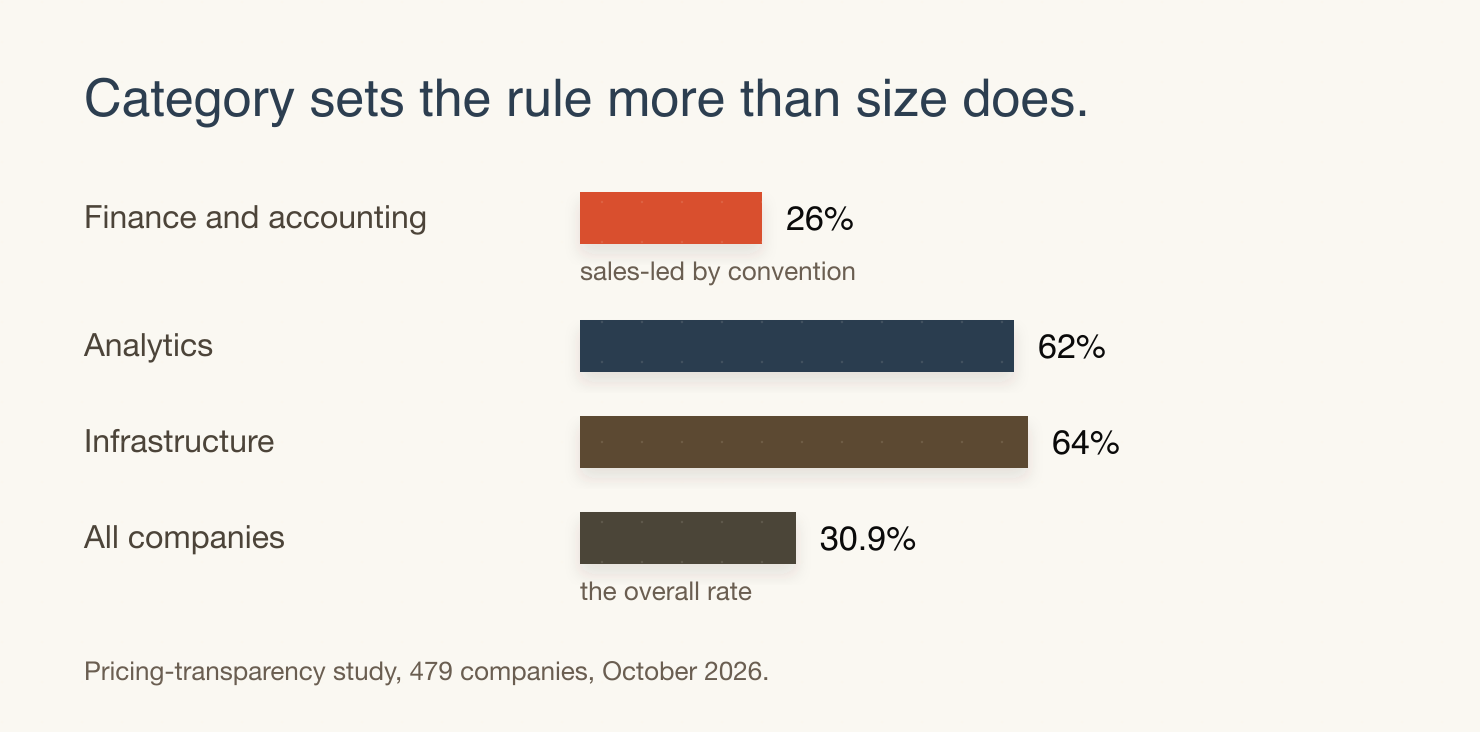
Category decides the rule more than size does
Finance and accounting software publishes a price 26% of the time.
Analytics is at 62%. Infrastructure at 64%.
That is a wider spread than the company-size ladder produces nearly anywhere else in this data. Category decides whether you are expected to publish, and it does so far more than your headcount does.
It also weakens the "we are too small to publish pricing" argument in analytics, where 62% of the field does it. A buyer moving between categories may hold you to a standard another market set.
The size signal is real but gentle. Publishing rates sit between 44% and 54% across every team-size band, from 1-10 employees through 200 and up. No stage exists at which publishing suddenly becomes expected. It is a choice, and categories make it differently.
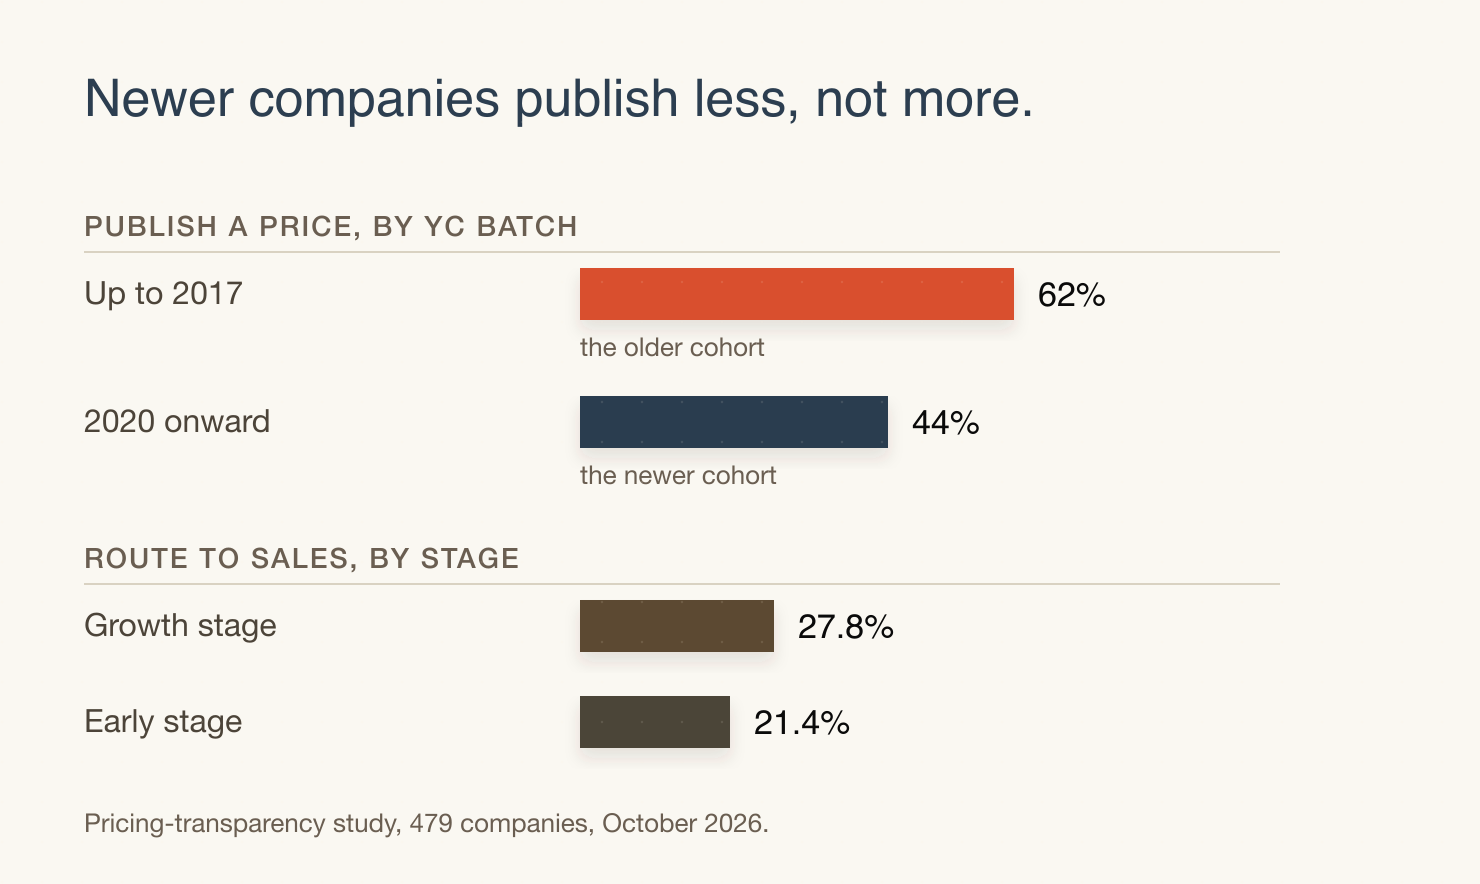
Older companies publish more than newer ones
Companies from YC batches up to 2017 publish a price 62% of the time. Companies from 2020 onward publish 44%.
An eighteen-point gap, running opposite to the usual assumption that newer software is more transparent. If anything, the newer cohort routes you to sales more readily.
Growth-stage companies route to sales more often than early ones, 27.8% against 21.4%. They are also less likely to be missing a pricing page entirely.
Read those two together and the pattern holds: the newer your company, the more likely the first human you speak to is the source of the price.
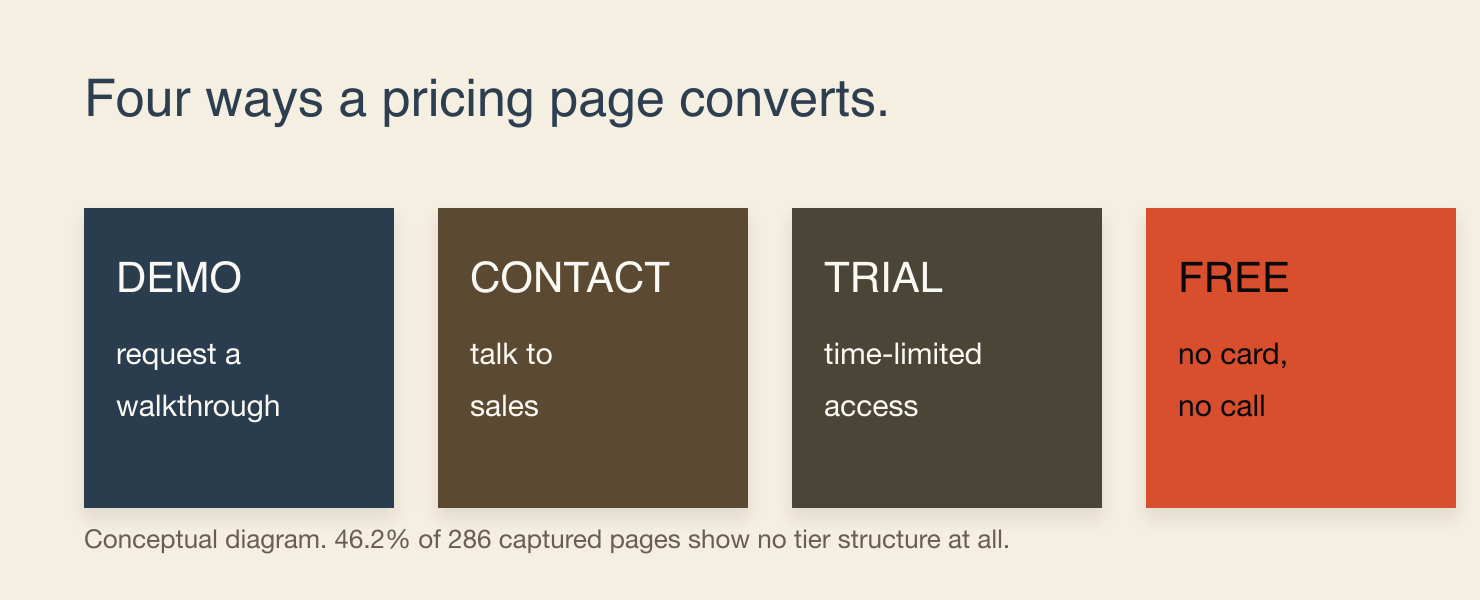
Your pricing page has four doors, and you only need one
The pricing-transparency study answers whether you publish a number. The tier study answers what happens when you do.
Of 286 pricing pages we captured live, 46.2% show no tier structure at all. Fifteen point seven percent show a single tier. Nine point four percent show two. Sixteen point eight percent show three. Eight point four percent show four.
Roughly half the market, then, publishes a price with no structure around it. A buyer reading a single unnamed tier gets a number and no way to reason about it.
Where structure exists, the shape is near-standard. Ordinal ladders, meaning three or more ascending levels, appear on 91.5% of free-plan pages and 77.1% of non-free pages. Fifty-one pages name an Enterprise tier. Twenty-eight point four percent of pages visually spotlight one.
Two things follow, and they pull in opposite directions.
Tier names are close to solved. Ladder naming appears on 85.4% of pages wherever tiers exist, so Basic, Pro and Enterprise are table stakes. Renaming your tiers is a positioning move, not a clarity move.
The spotlight is marketing rather than advice. Among structured pages the spotlight rate runs from 39.3% at per-seat vendors down to 17.6% at contact-only vendors. A buyer who has been visually steered toward a tier has not been given a recommendation.
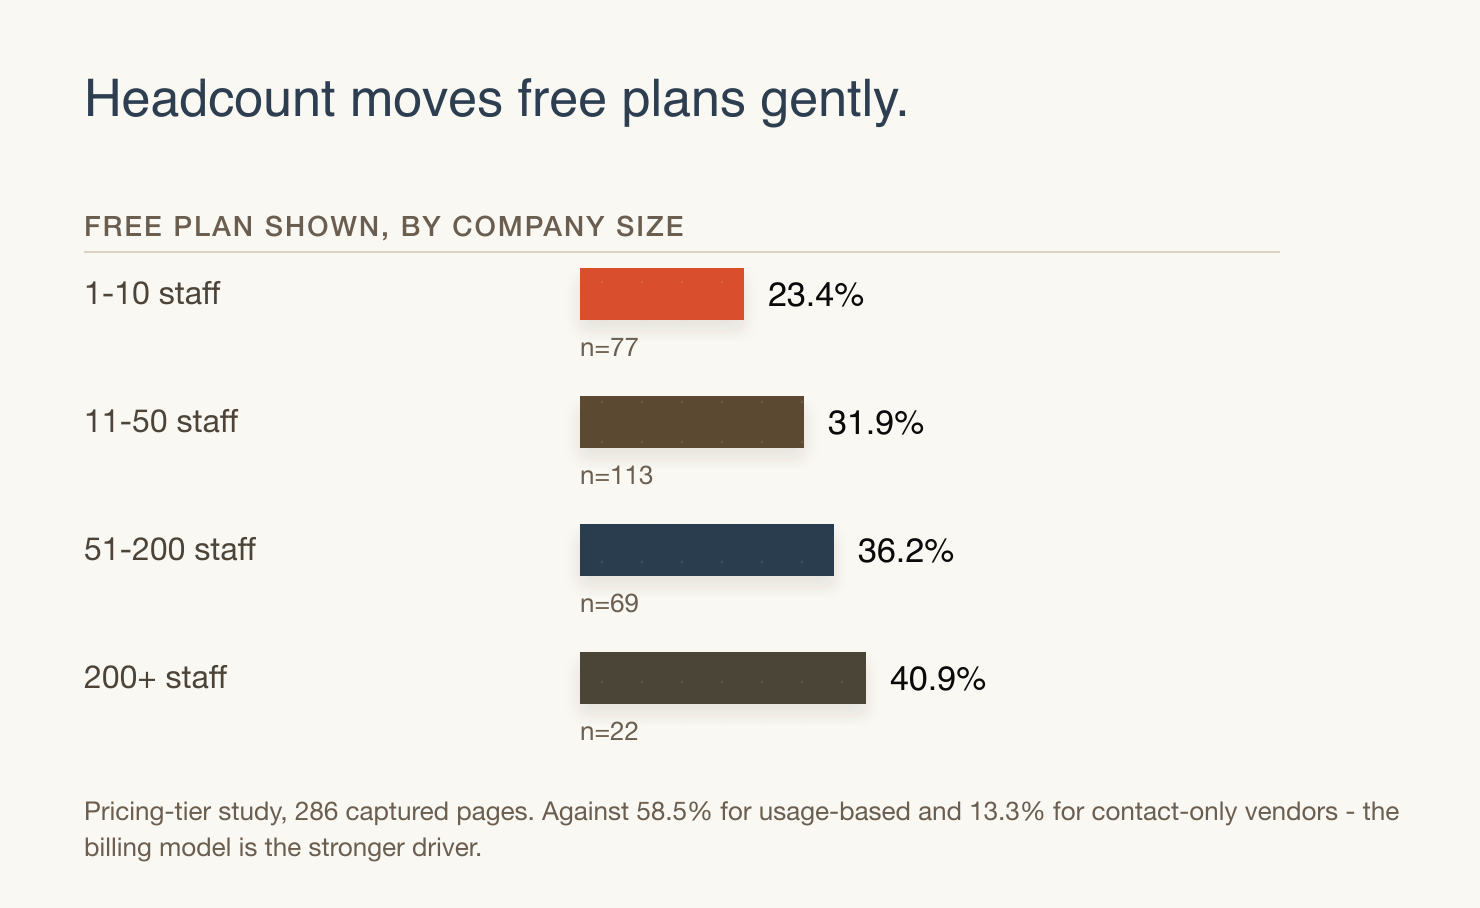
Free plans follow your billing model
The free-plan finding belongs in a pricing review, because it is counter-intuitive and it is actionable.
Across the same 286 pages, 31.8% show a free plan and 17.1% show a trial with no free plan.
By company size the rate is gentle: 23.4% at 1-10 employees, 31.9% at 11-50, 36.2% at 51-200, 40.9% at 200 and up. A slope, not a cliff, and it mostly reflects larger companies having more products to gate.
By billing model it is not gentle at all. Matched against the pricing-transparency study of the same companies, 58.5% of usage-based vendors show a free plan, against 13.3% of contact-only vendors.
Your free plan is a function of how you charge, not of how old you are. Usage-based vendors sit close to table stakes here, and the absence of a free tier reads as a gap. Contact-only vendors sit close to table stakes in the other direction, and the absence reads as deliberate.
Either way the buyer works out which one you are. It helps to have decided first.
A note on how confident we are
Two caveats, because they belong in the same breath as the headline.
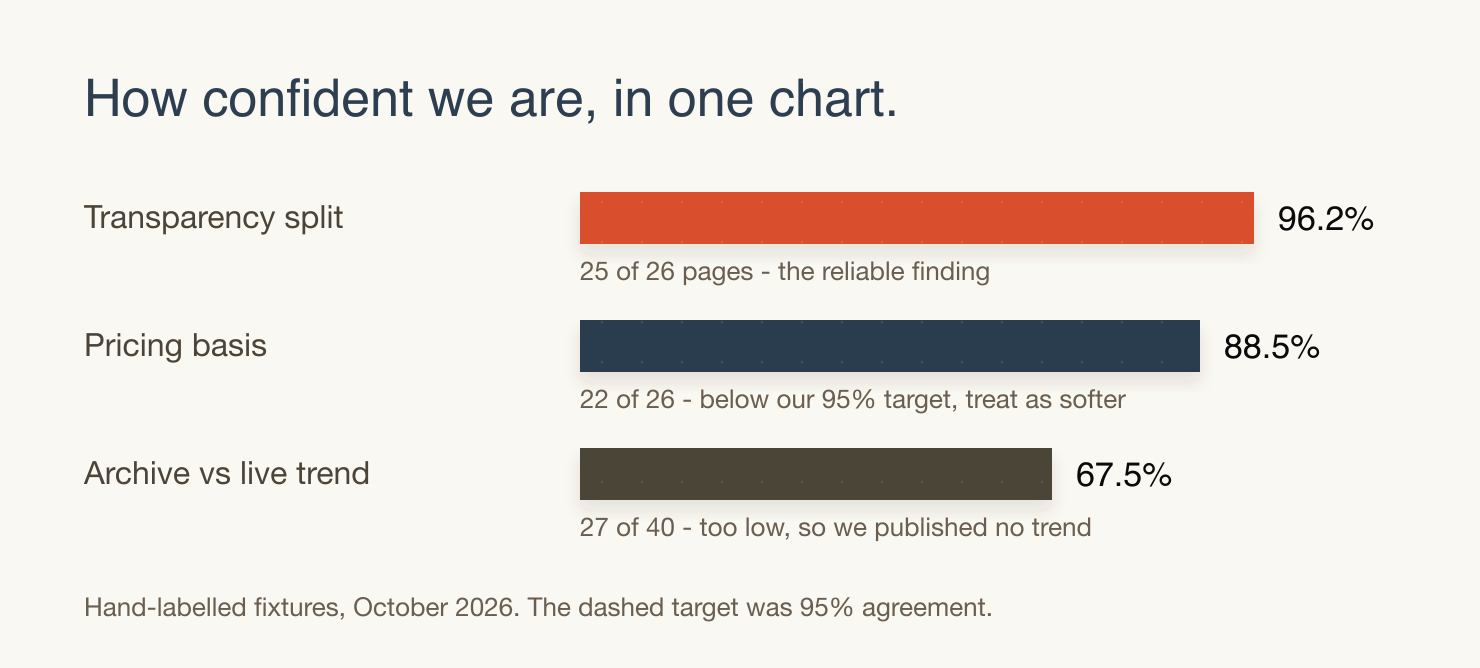
Our hand-coded fixture matched basis classification on 22 of 26 pages, 88.5%, below the 95% target we set ourselves. The pricing-basis split is the softer number in this study.
The transparency split (published, contact-only, page-without-price, no-page) matched on 25 of 26, or 96.2%. That is the reliable finding. If you quote one number from this study, quote that one.
We also tried a trend check against an earlier archive, then dropped it. Archived and live pricing pages agreed on only 27 of 40 companies we could match, 67.5%. Far too little agreement to support any claim about direction, so we published no trend line.
All of this describes 479 venture-backed companies. It does not generalise to bootstrapped or legacy vendors, and it is not market share.
What to do with this
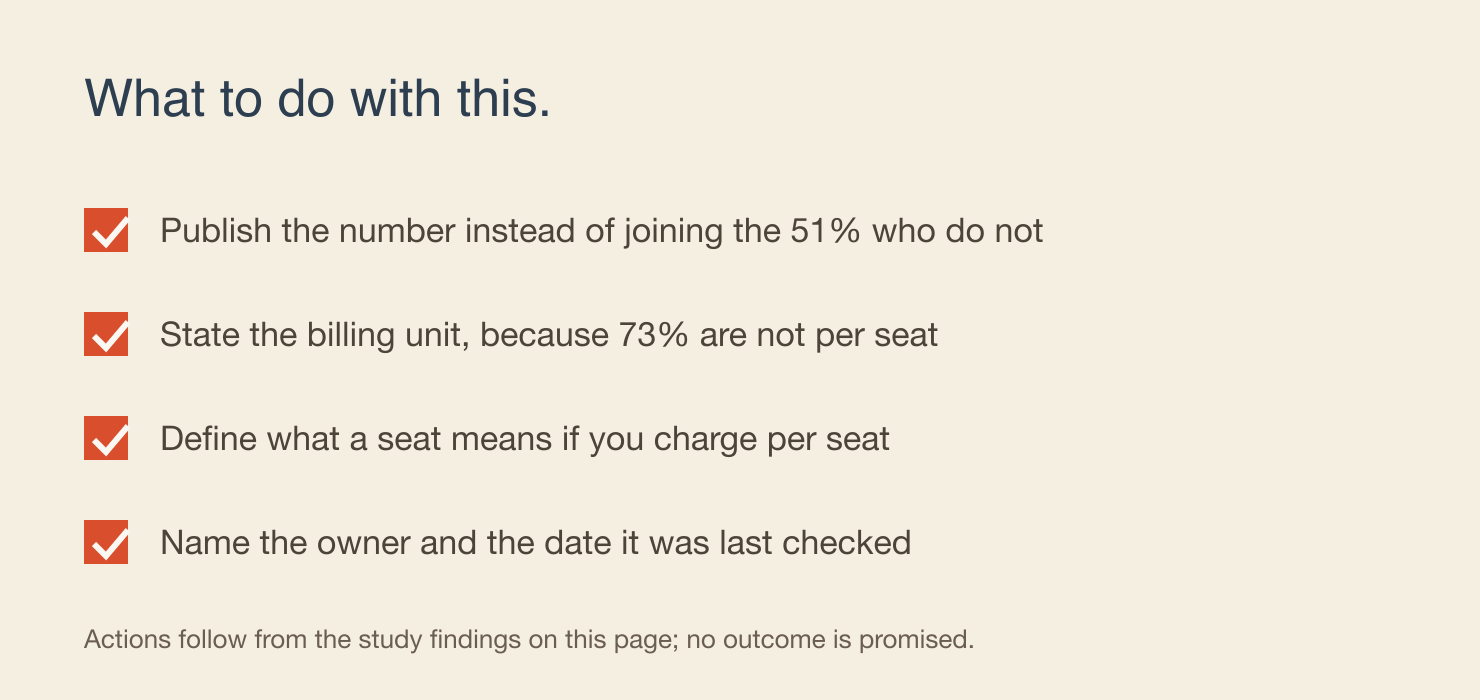
Publish nothing and you have joined 51% of the sample for no gain. Put the number on the page.
Publish a number and you still need to state the unit. Most of the market is not per seat, and your buyer is probably budgeting per seat.
Publish per seat and you need to define the seat. An undefined seat is an argument waiting to happen.
Publish one tier and ask whether a buyer can reason about it. A single number with no structure is a price, not an offer.
In every case, name somebody who owns the number and a date it was last checked. A price with an owner ages gracefully. A price with no owner goes stale quietly and gets quoted by an AI answer for a year.
One thing not to do. Do not add a pricing page to look more transparent than a competitor who has correctly decided not to publish. In a category where 26% of finance software and 64% of infrastructure software publish prices, your category sets the expectation, not your rival's homepage.
Publishing a number you would rather discuss privately is a small loss of control. Being the vendor no buyer can price is a larger one, because you do not get to make the argument.
Wrap-up
The pricing page is not a transparency scorecard, and publishing a number is not a favour you do for buyers. It is the cheapest available way to enter a comparison you are currently not in.
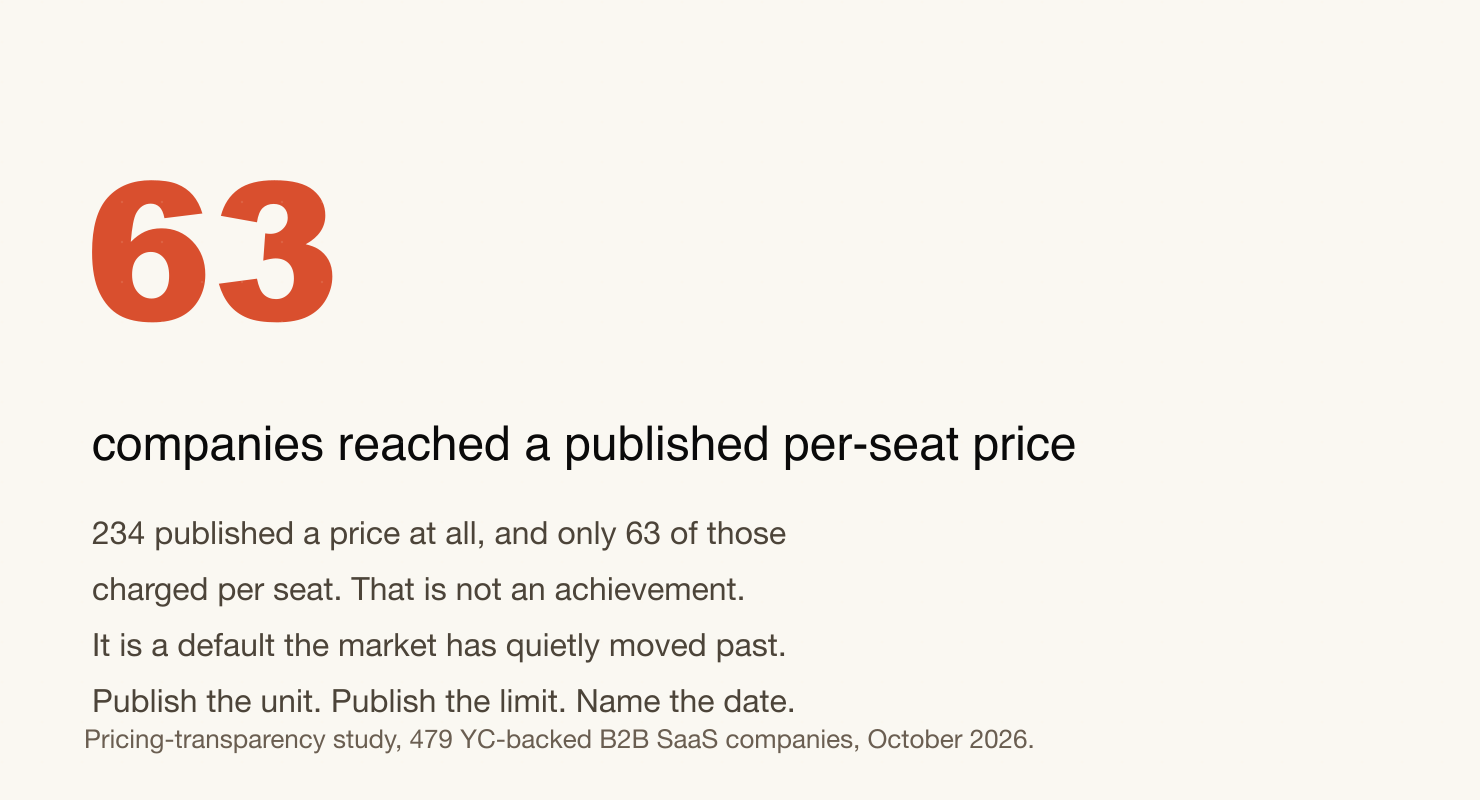
Sixty-three companies in our sample reached the narrowest, most useful state. A published price, in a stated unit, on a page that explains what the unit means.
That is 13% of the market. Everyone else has left a gap where the buyer's budget line should be.
That is not an achievement. It is a default the market has quietly moved past.
Publish the unit. Publish the limit. Put a name and a date on it.
Want to see whether your page actually delivers that?
Take the page a prospect hits first and scan it for the decision friction between your claims and their questions.