

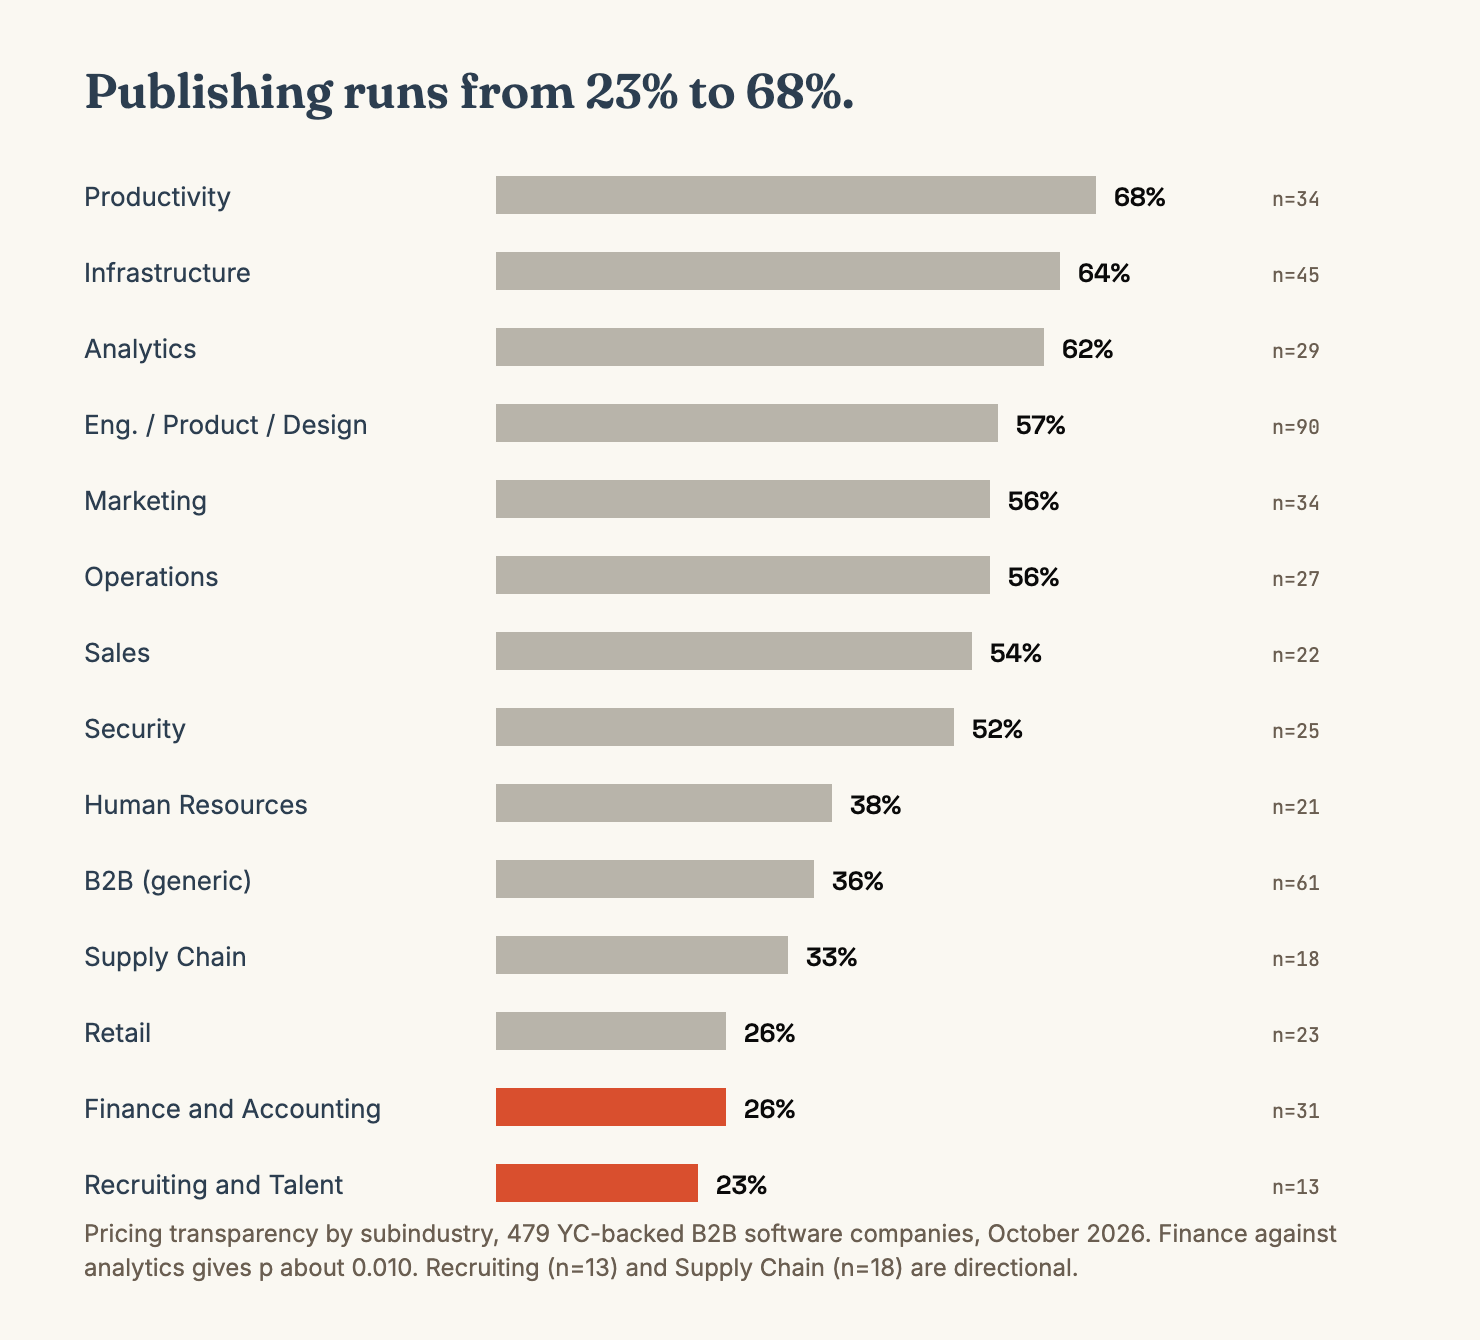
Across 479 B2B software companies the publishing rate runs from 23% to 68% depending on what you sell. Category predicts it far better than size.
We checked the live pricing pages of 479 YC-backed B2B software companies in October. 49% published a price.
That headline number hides the only finding worth having. The rate is not evenly distributed across the market. It varies enormously by what a company sells, and almost not at all by how big it is.
A productivity tool publishes 68% of the time. A recruiting tool publishes 23% of the time. Both are B2B SaaS. Both are probably selling to someone who needs to justify a budget line.
If you are deciding whether to publish your pricing, the honest input is not your philosophy about transparency. It is what your category does, and what your buyer has learned to expect from it.
The full pricing-transparency study has the subindustry cut. This is what I take from it.
The spread is wider than anyone expects
Publishing rates by subindustry, across the 479:
| Subindustry | Publish a price | n |
|---|---|---|
| Productivity | 68% | 34 |
| Infrastructure | 64% | 45 |
| Analytics | 62% | 29 |
| Engineering, Product and Design | 57% | 90 |
| Marketing | 56% | 34 |
| Operations | 56% | 27 |
| Sales | 54% | 22 |
| Security | 52% | 25 |
| Human Resources | 38% | 21 |
| B2B (generic) | 36% | 61 |
| Supply Chain and Logistics | 33% | 18 |
| Retail | 26% | 23 |
| Finance and Accounting | 26% | 31 |
| Recruiting and Talent | 23% | 13 |
The gap between the top and the bottom is 45 points.
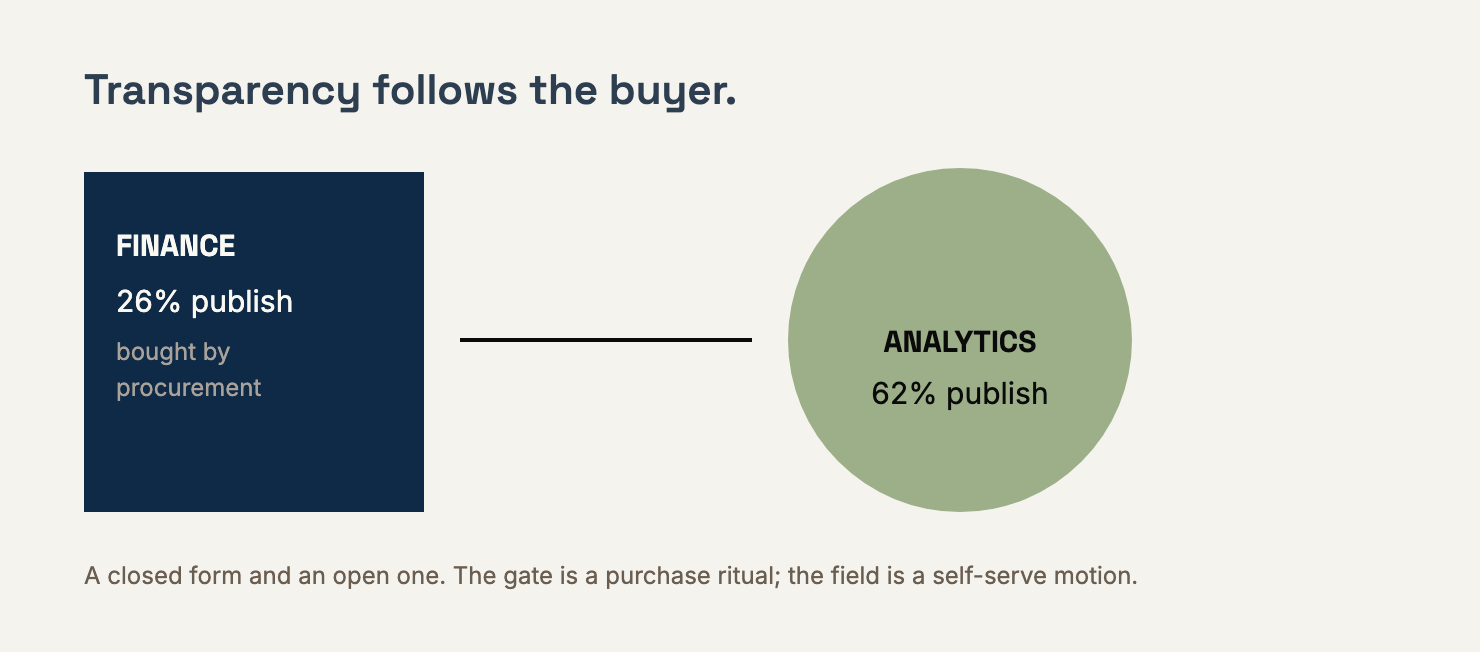
Finance and accounting at 26% against analytics at 62% is not noise. The permutation test on that pair gives p of about 0.010.
A few of these bands are small. Recruiting has n=13 and Supply Chain n=18, so treat those rows as directional. But Productivity (n=34), Finance and Accounting (n=31), Infrastructure (n=45) and Engineering/Product/Design (n=90) are large enough to argue with.
Why finance hides and analytics does not
The pattern has a logic to it once you look at who signs the cheque.
Finance and accounting software is bought by people who evaluate vendors for a living. Procurement, controllers, CFO offices. These buyers do not need a pricing page, because a pricing conversation is part of the purchase they expect. Routing them to sales costs the vendor nothing and confirms the buyer's sense that the product is serious.
Analytics and infrastructure are bought by teams who expect to start using the thing this afternoon. A usage-based data tool with no published price is a tool that has decided its self-serve motion is a marketing feature rather than the actual motion.
So transparency follows who the buyer is, not who the vendor is. The same company would publish a price in one category and hide it in another.
I find this more useful than any transparency argument, because it is descriptive rather than moral. Hiding a price in finance is not a failure of nerve. Publishing one in recruiting would be the odd move.
Company size barely moves it
This is the part that surprises most teams, because the intuition is that bigger, more enterprise companies publish less.
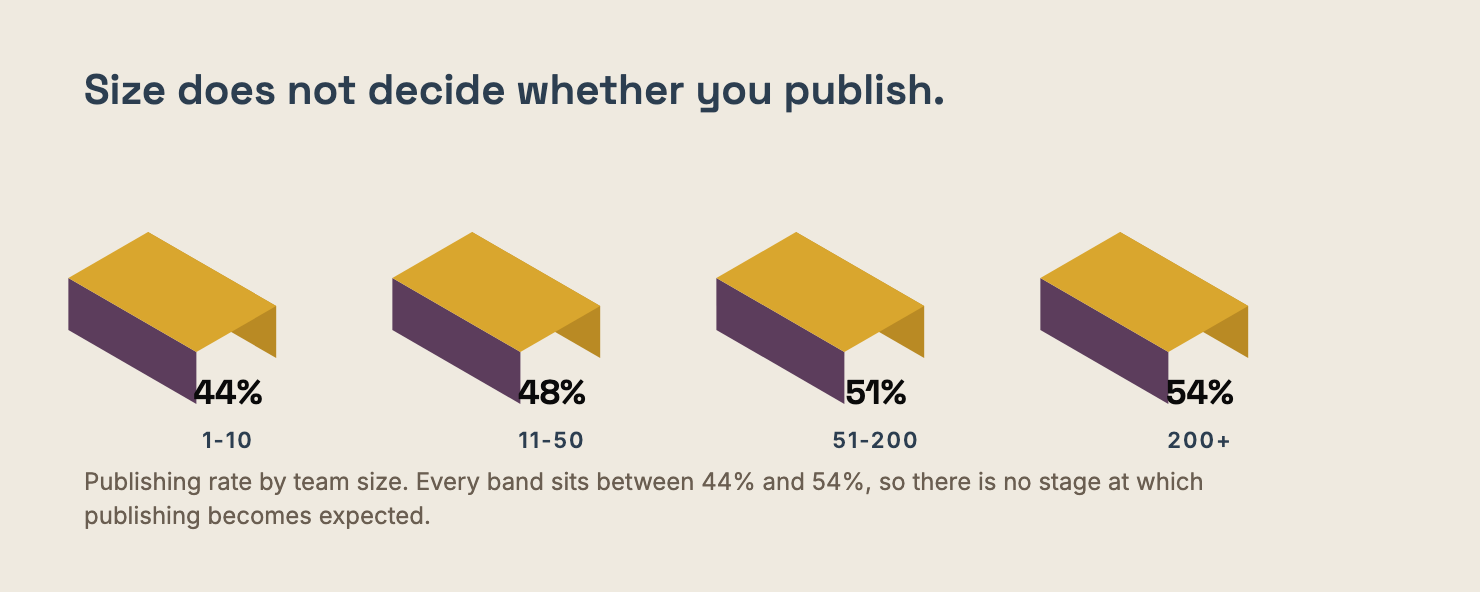
Publishing rates sit between 44% and 54% across every team-size band, from 1-10 employees through 200 and up. There is no stage at which publishing suddenly becomes expected, and no stage at which it suddenly becomes rare.
What does move is age, and it moves the wrong way. Companies from YC batches up to 2017 publish a price 62% of the time. Companies from 2020 onward publish 44%.
We would not lean hard on that one. We could not separate batch age from company size in this sample, so it is an association and nothing more.
But it does not support the common assumption that newer software is more transparent. In this cohort, the newer companies route you to sales more readily.
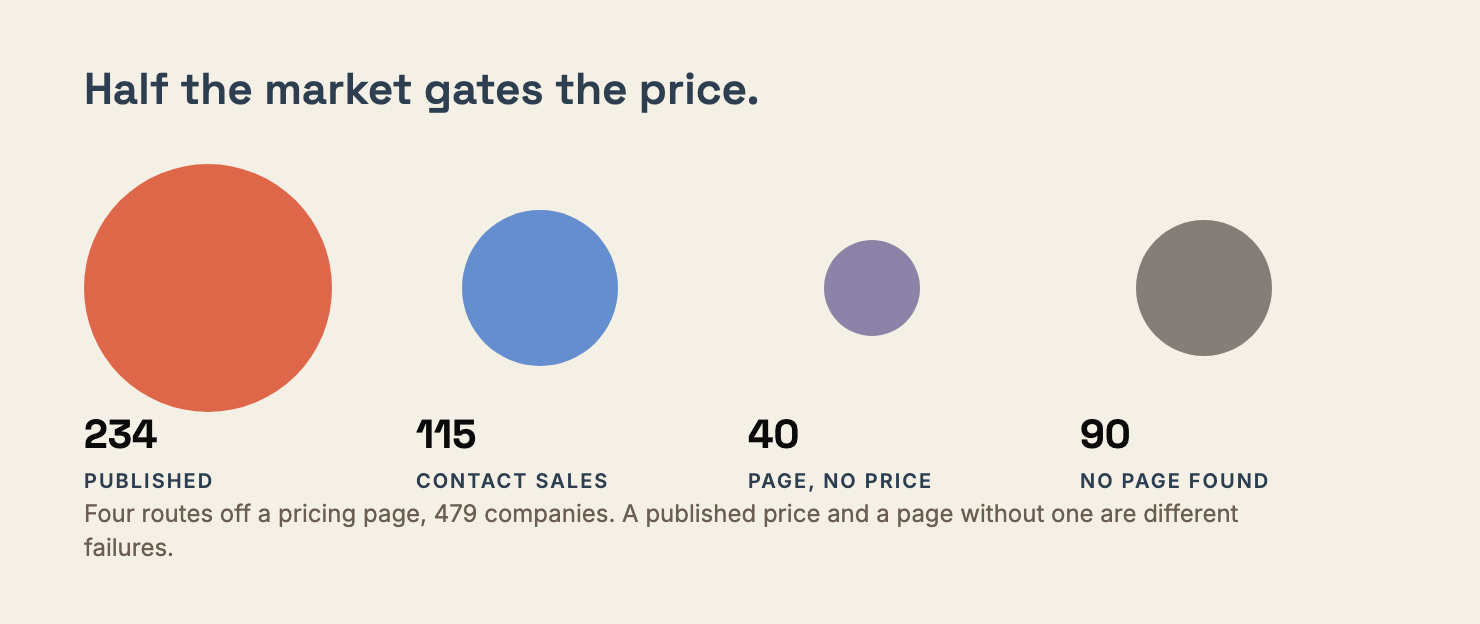
Half the market has a pricing page with no price on it
The 51% who do not publish a number are not all doing the same thing.
Of the 479, 115 route the visitor to contact sales. Another 40 have a pricing page with no numbers on it at all. And 90 had no pricing page we could find.
That middle group is the strange one. A pricing page with no price is a page that has absorbed the cost of being built, and the reputational cost of looking evasive, while delivering neither a number nor the clean excuse of a "talk to us" button.
If you are going to gate the price, gate it deliberately. A page listing features with "contact us" on every tier is the worst of both formats. Forty companies in a 479-company sample are doing exactly that.
The pricing-tier study finds the same shape from a different angle. Of 286 captured pages, 46.2% show no tier structure at all. Roughly half the market publishes a price, or a route to a conversation, with nothing to reason about in between.
The unit problem is bigger than the price problem
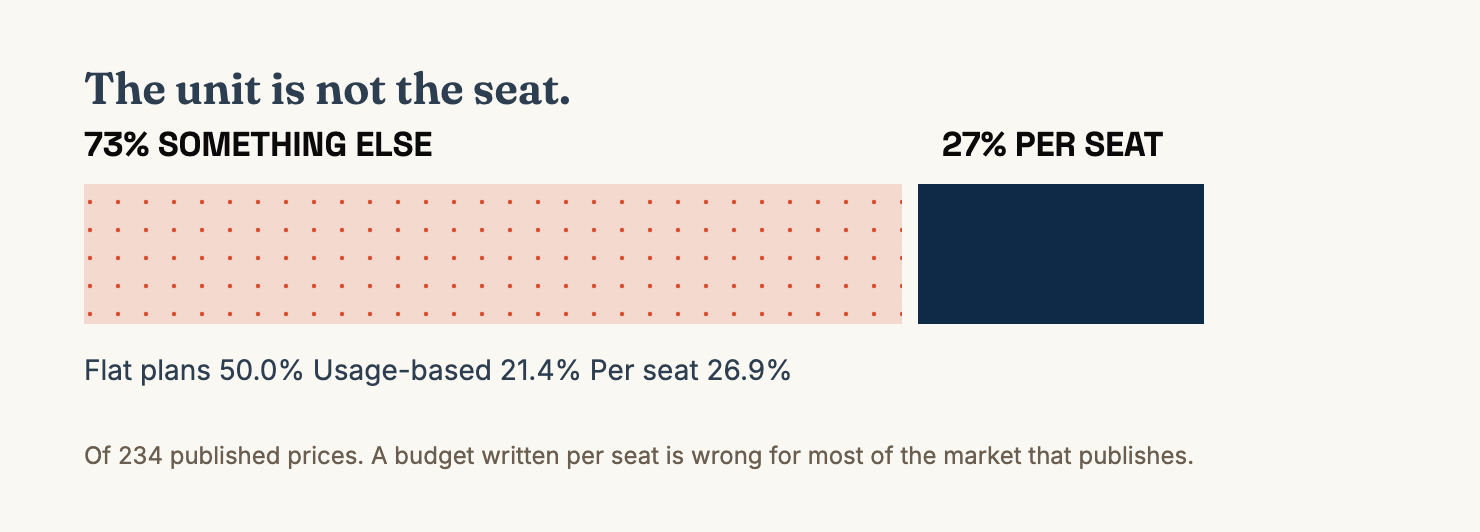
Among the 234 companies that did publish a price, only 26.9% published a per-seat price. Half published a flat monthly figure. Twenty-one point four percent published usage-based pricing.
So 73% of published prices are not per seat, which is the unit a procurement team will assume.
This matters more than the price gate itself. A buyer who cannot work out your billing unit cannot build a budget line. And a budget line is what gets you into a shortlist.
Publishing "$99" while your product bills per credit is not transparency. It is a number that will be wrong in the deck that goes to the CFO, and the buyer will not come back to ask.
One sentence fixes it. "Priced per active contact, not per seat" costs nothing and removes a whole category of late objection.
The ninety with no page to find
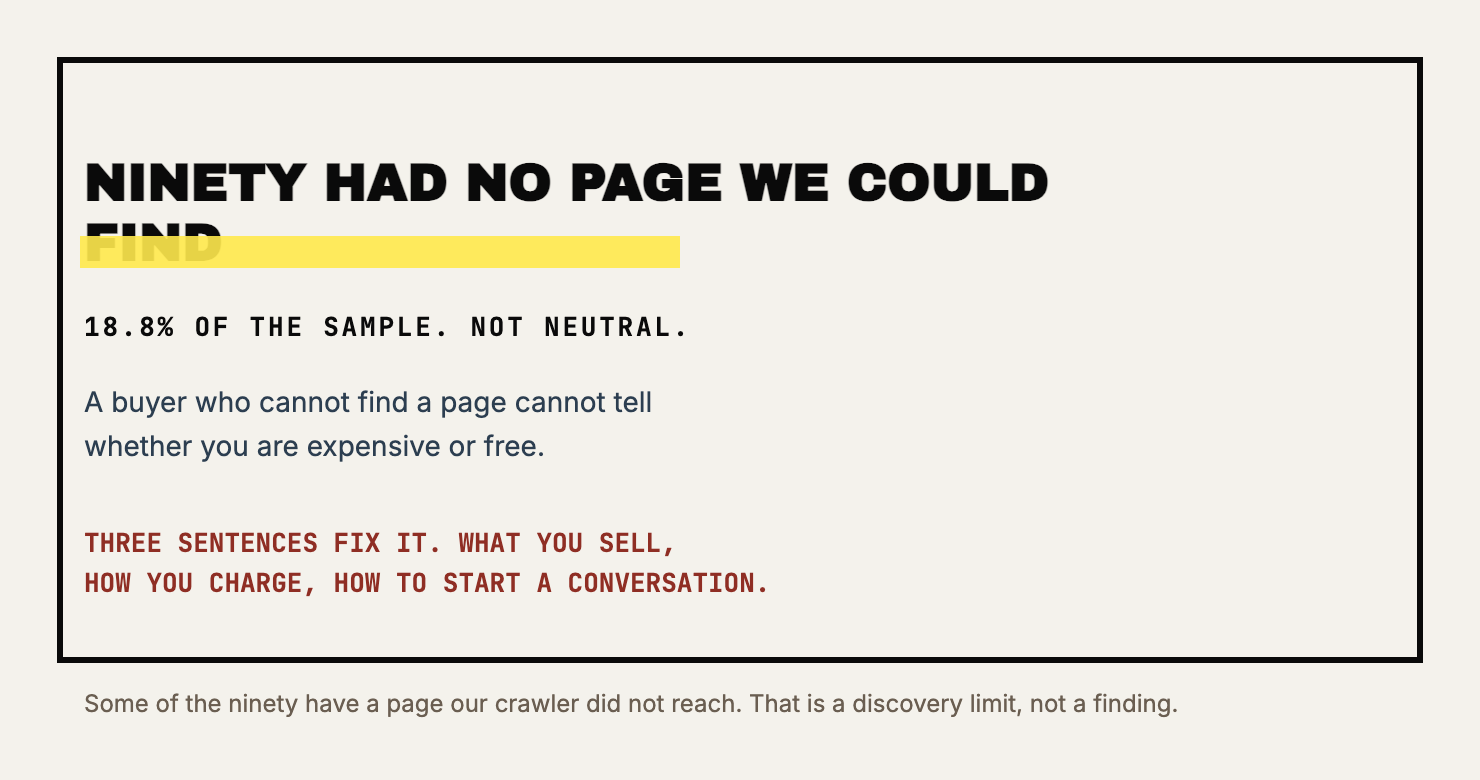
Ninety of the 479 companies had no pricing page we could find at all. That is 18.8%, the largest single group in the non-publishing half.
It is the one people skip past, because a page with no price is easier to discuss than no page at all.
We cannot tell you why those ninety are missing. Some have a pricing page our crawler did not reach. Some route pricing through a partner. Some are genuinely early enough that they have not built one.
What we can say is that a missing pricing page is not neutral. A buyer who cannot find a page has no way to tell whether you are expensive or free, and in the absence of a signal people assume the worse of the two.
If you are in that group, the fix is not a pricing strategy. It is a page with three sentences: what you sell, how you charge, and how to start a conversation. That costs an afternoon and removes an unknown the buyer has no way to resolve.
What this means if you are deciding
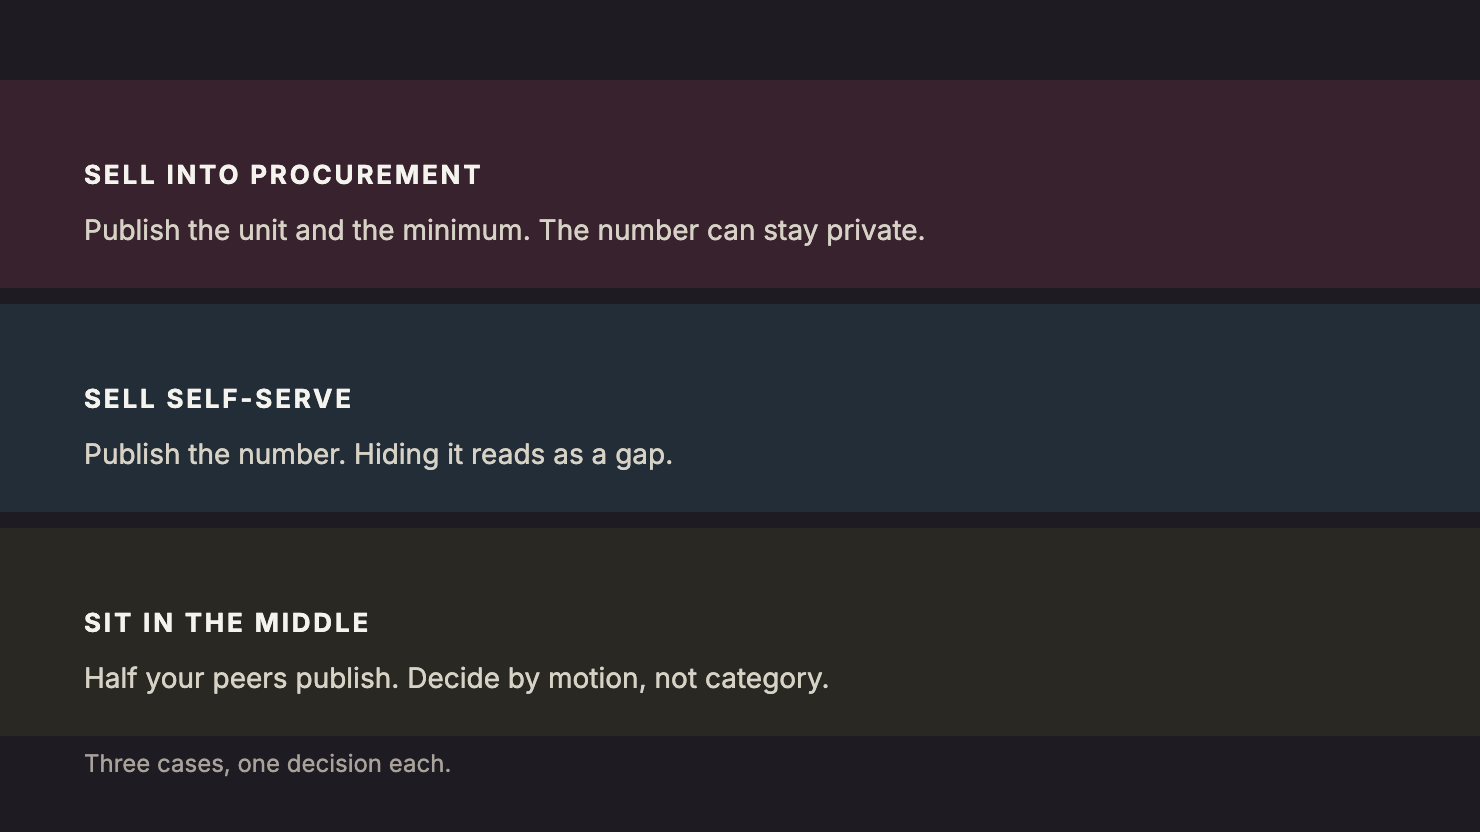
Three cases, and they come out differently.
*You sell into procurement.* Finance, HR, recruiting, supply chain. Your category norm is a conversation, and publishing a price will not win you much. Publish the billing unit and the minimum commitment anyway, because that is the part a buyer genuinely cannot guess.
*You sell self-serve.* Productivity, analytics, infrastructure, developer tools. Your category norm is a number, and hiding yours reads as a gap rather than as enterprise sophistication. Publish it.
*You sit in the middle.* Sales, marketing, security, operations. Roughly half your peers publish, so the decision is about your motion rather than your category. If a stranger could reasonably start using your product this week, publish. If not, quote.
What to publish if you will not publish a number
Deciding not to show a price is one choice. Deciding what replaces it is another, and most vendors never make that second decision deliberately.
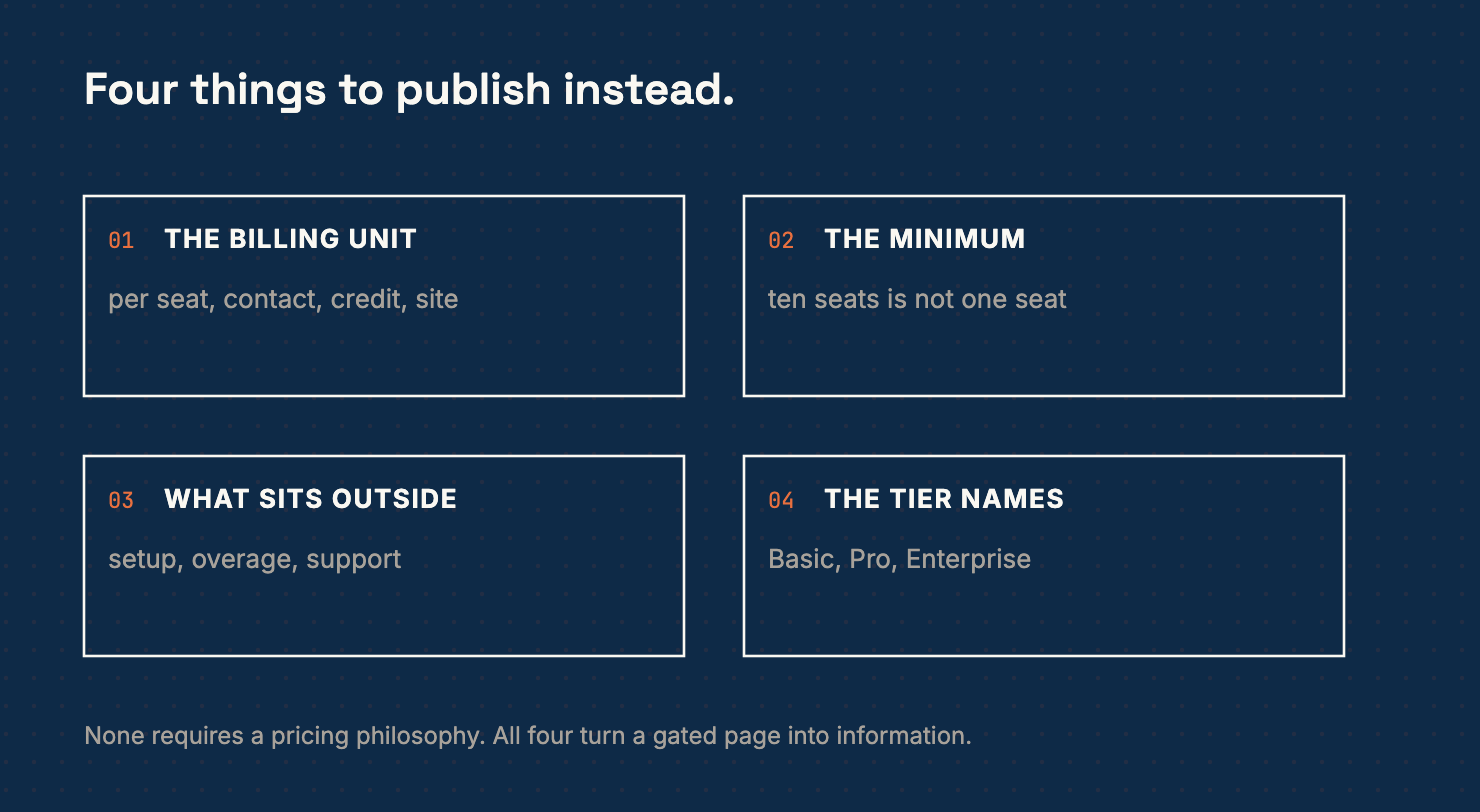
Four things carry most of the weight, and none of them is a number.
State the billing unit. Per seat, per contact, per credit, per site, per workspace. This is the single thing a buyer cannot infer from a feature list, and 73% of the prices in this sample are not the unit a buyer will assume.
State the minimum commitment. A floor of ten seats and a floor of one are different products wearing the same pricing page.
State what sits outside the subscription. Setup, usage overages, premium support and third-party dependencies are where the surprise lives, and a buyer who finds them on a call remembers who hid them.
Name the tier and what it is for. The pricing-tier study found ladder naming appears on 85.4% of pages where tiers exist, so Basic, Pro and Enterprise are already a shared language. You do not have to publish a price to use it.
None of that requires a pricing philosophy debate. It is four sentences, and it turns a gated page from an obstacle into information.
How confident we are
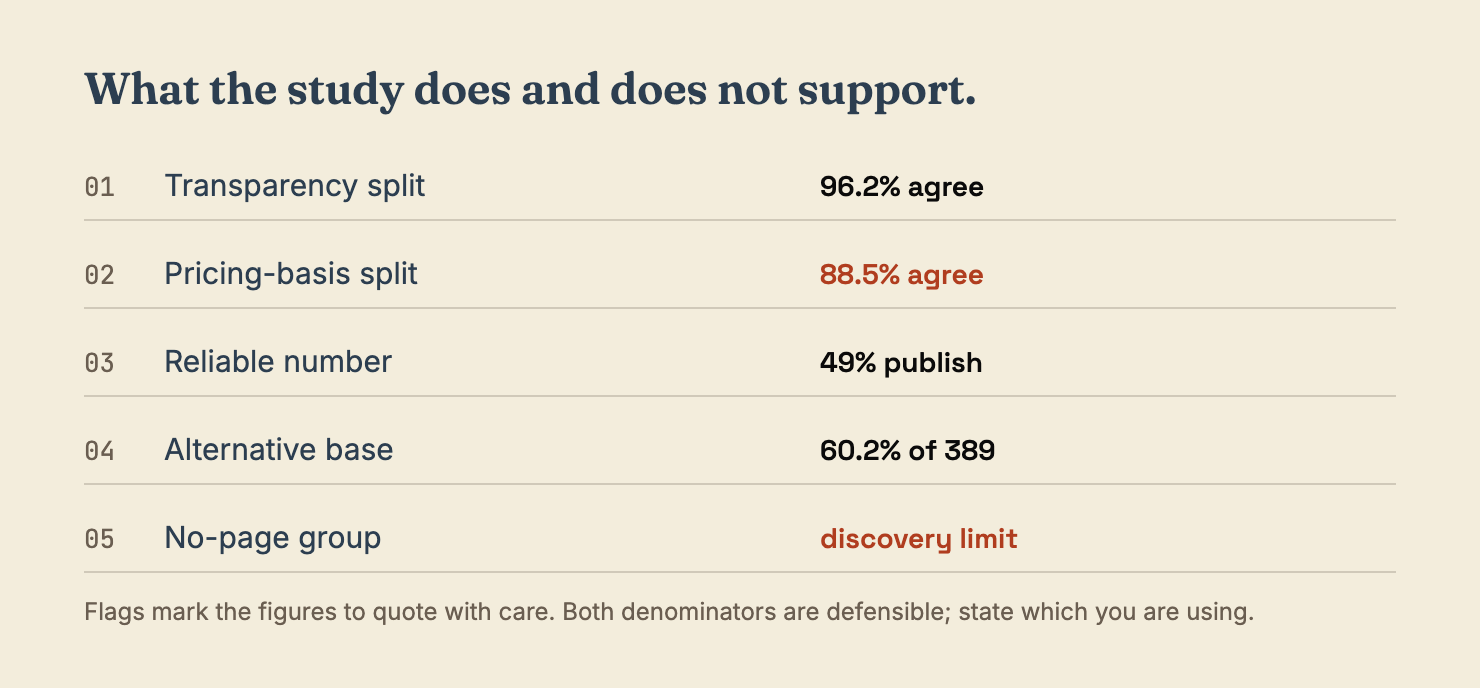
The transparency split, meaning published, contact-only, page-without-price, no-page, matched on 25 of 26 hand-labelled pages. That is 96.2%, and it is the reliable finding in this study.
The pricing-basis split, meaning per seat versus flat versus usage, matched on 22 of 26, or 88.5%. That is below the 95% target we set ourselves, so treat the 26.9% per-seat figure as softer than the rest.
The 90 companies with no pricing page we could find are a discovery limit, not a finding about those companies. Some of them certainly have a page we did not reach.
Quote the 49% headline with that caveat attached, or use the alternative denominator: 60.2% of the 389 companies with a findable pricing page publish a number. Both are defensible. State which one you are using.
And the whole sample is 479 venture-backed companies, weighted toward recent YC batches. It describes that population. It is not the B2B software market.
Wrap-up
Category predicts pricing transparency better than size, philosophy or maturity does. A productivity tool that hides its price is going against its own market. A finance tool that publishes one is not being unusually brave.
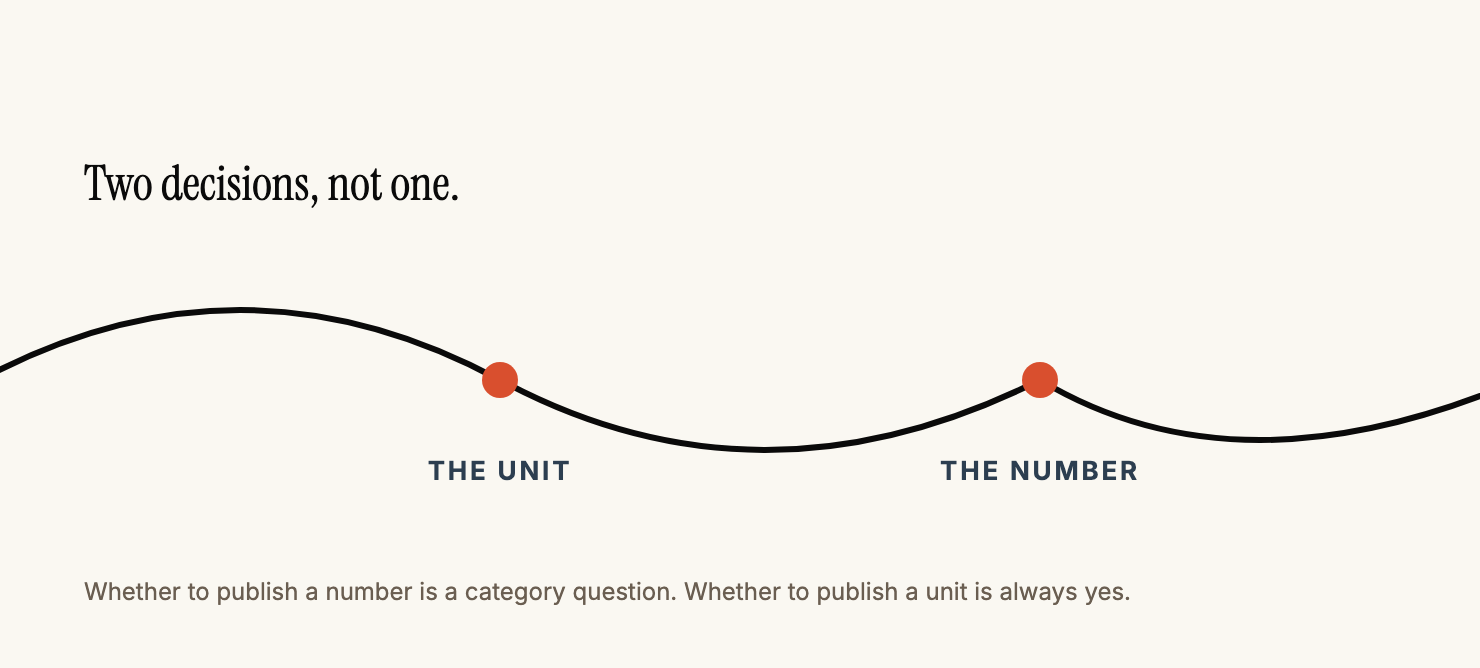
The useful move is to separate two decisions that teams collapse into one. Whether to publish a number is a category question, and your category has already answered it. Whether to publish a unit is a buyer question, and the answer to that one is always yes.
Most of the market leaves a buyer to guess. That is the cheapest fix available on a pricing page, and it is the one most vendors skip.
Want to check what your own pricing page actually tells a buyer?
Take the page a prospect reads before they decide whether you are worth a call and scan it for the decision friction between your claims and their questions.