

Your competitor's comparison page is not why you lost the deal. It is what the buyer could not find on yours.
We measured 479 YC-backed B2B software companies in October. Only 49% of them publish a price on their pricing page.
Barely half.
The rest route you to sales. Or they show you a page with no numbers on it. Or there is no pricing page we could find at all.
I know how that number looks to a vendor who has decided "contact sales" is the right call. Usually it is the right call. That is rather the point. The figure describes a strategy, not a failure.
But it also describes the buyer's afternoon. And the buyer's afternoon is what you are actually being compared on.
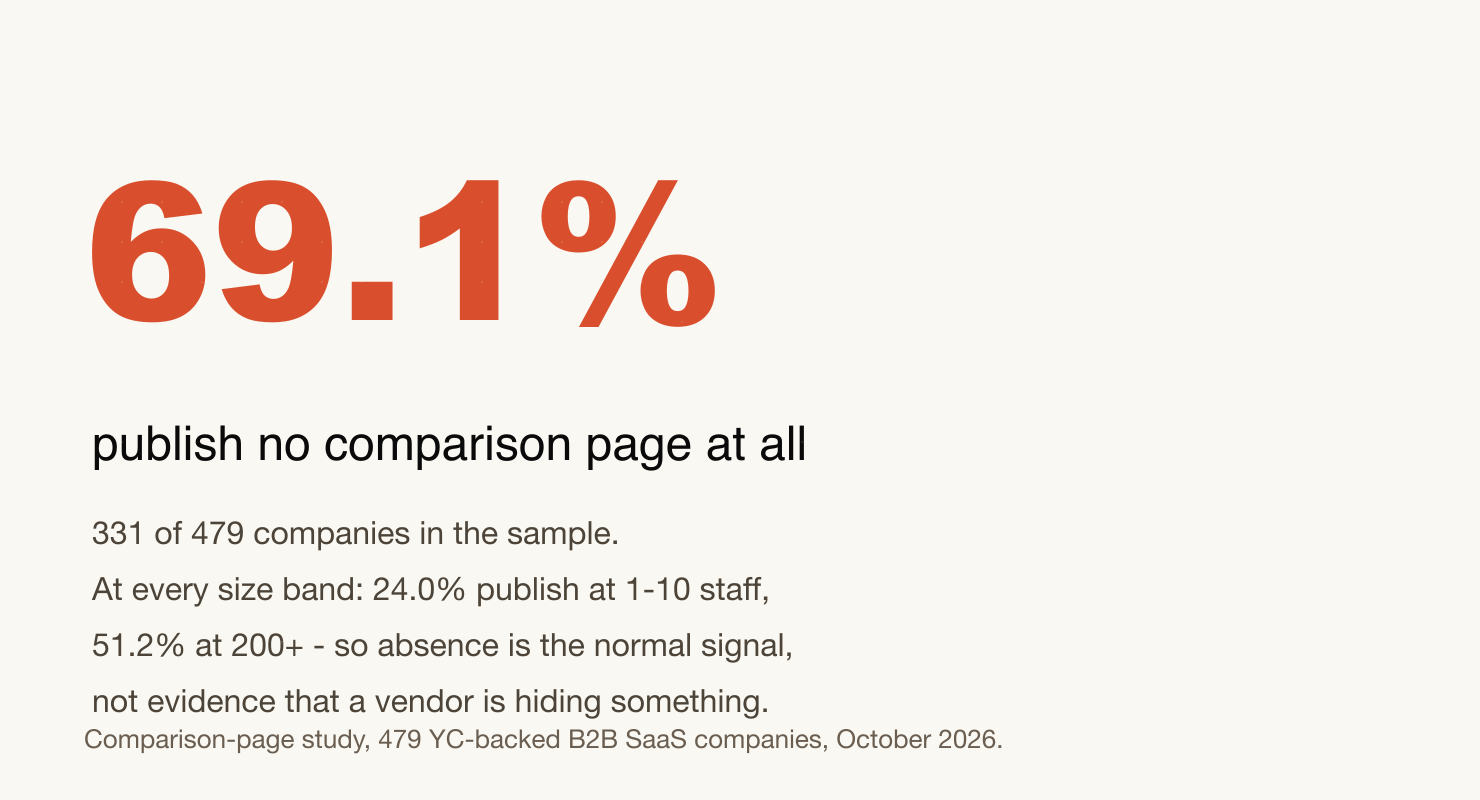
Here is the uncomfortable half. When we looked at comparison pages across the same 479 companies, 69.1% published none. At every company size. Not just the small ones. The 200-employee companies too.
Most vendors are not losing to a rival's clever comparison page. They are being shortlisted against a name they never wrote down.
Your price is probably not per seat
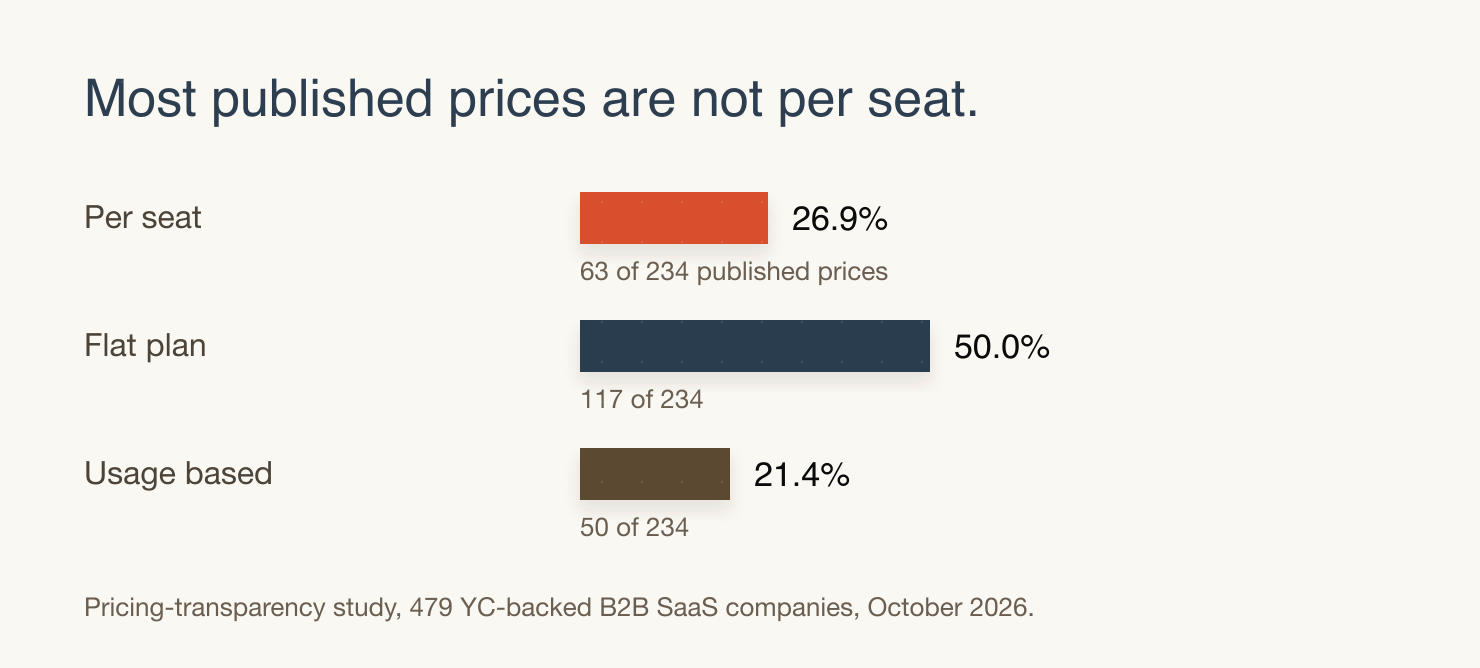
Of the 234 companies in that study that published a price, only 26.9% published a per-seat price. Half published a flat monthly figure. Another 21.4% published usage-based pricing.
So 73% of published prices are something other than "per user, per month".
Not a rounding error.
A pricing page can fix this in an afternoon. Procurement teams default to seats when they build a budget model, because seats are the unit they can allocate across departments. If your product is priced per credit, per contact, per site or per 1,000 units, and your page does not say so, somebody will build a model that is wrong by a wide margin. They will not come back and ask. They will price you out of their own shortlist quietly.
A budget written as "per user per month" will be wrong for most of the market that publishes. Yours is not a special case.
Where you do publish a per-seat price, publishing rates sit between 44% and 54% across every team-size band. Maturity does not explain it. It is a choice.
Careful with that finding, though. It describes what these 479 venture-backed companies do on the pages we could reach. It says nothing about the rest of the market, and nothing about what any individual buyer will pay.
Absence is the normal signal
The most useful number in the comparison-page study is the 69.1%.
Read it correctly before you put it in a board deck. It does not mean vendors without comparison pages are hiding something. Most of them simply are not running a comparison programme.
It means a buyer evaluating your category should expect to find comparison pages from some vendors, and should read the ones that appear as editorial work rather than as proof about you. In that sample, 34.5% of comparison pages compared two vendors who were both third parties to the publisher. Those pages are not flattering to anyone, and they are often the most honest in the set.
The useful move is the opposite of reacting to rivals. Ask what a neutral third party could credibly say about the decision, then make sure that page exists somewhere you can point to.
Treat a comparison page as a maintained asset
Here is the finding I would put in front of any team proposing a comparison blog post.
Of 1,683 vendor comparison pages we classified across the 479-company sample, 74.3% sat on permanent structured paths (`/compare/`, `/alternatives/`, `/vs/`). Only 25.7% were blog posts.
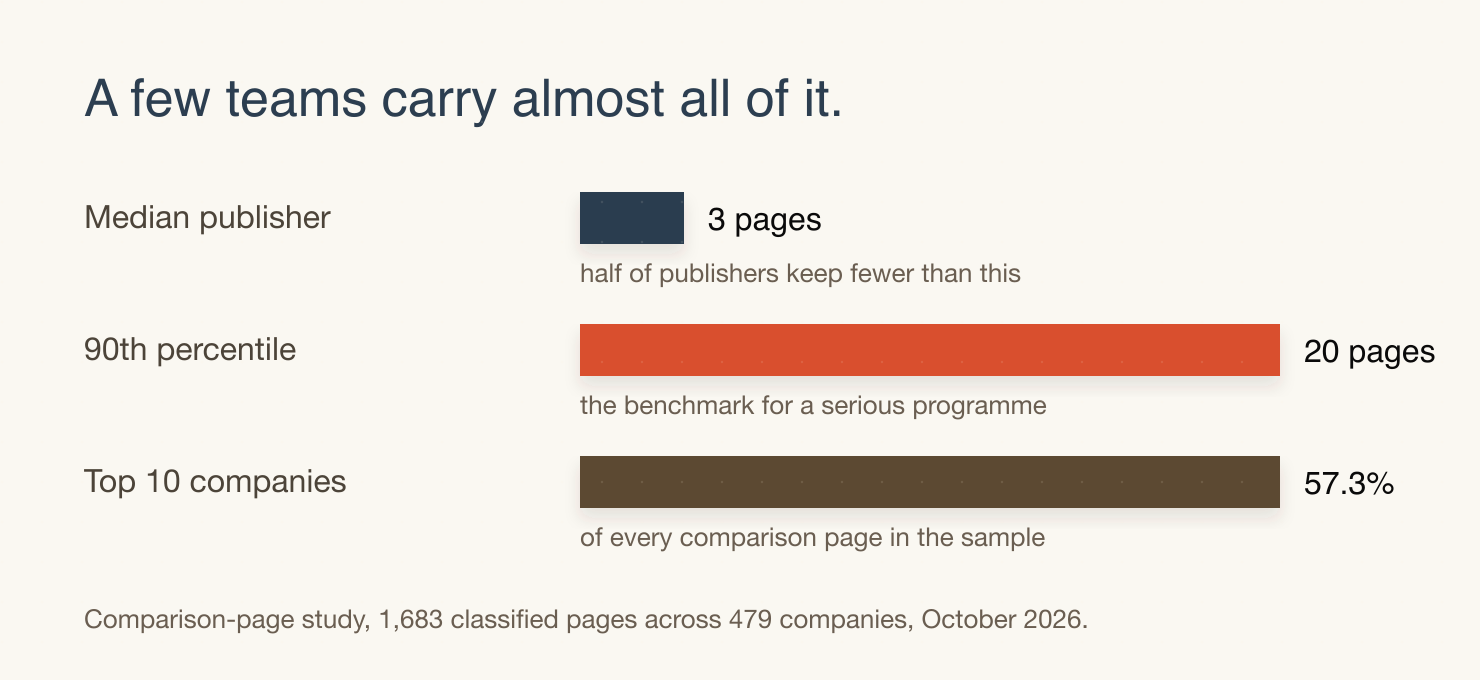
The median publisher maintains three. The 90th percentile maintains twenty. The top ten companies produce 57.3% of every comparison page in the sample.
That distribution is the lesson. A serious comparison programme looks like a library somebody owns and updates. It does not look like a quarterly piece of content.
The same study caught us out. Of the candidate URLs containing "vs", 77.0% were concept articles ("lead vs prospect", "inbound vs outbound") and only 19.3% compared vendors. Counting URLs that contain "vs" is not a proxy for comparison coverage. We had to read the titles.
If you are counting your own coverage by URL pattern, you are probably counting the wrong thing.
A free plan follows your billing model
From the tier-naming study, across 286 captured pricing pages: 31.8% show a free plan, and 17.1% show a trial with no free plan. But 46.2% show no tier structure at all.
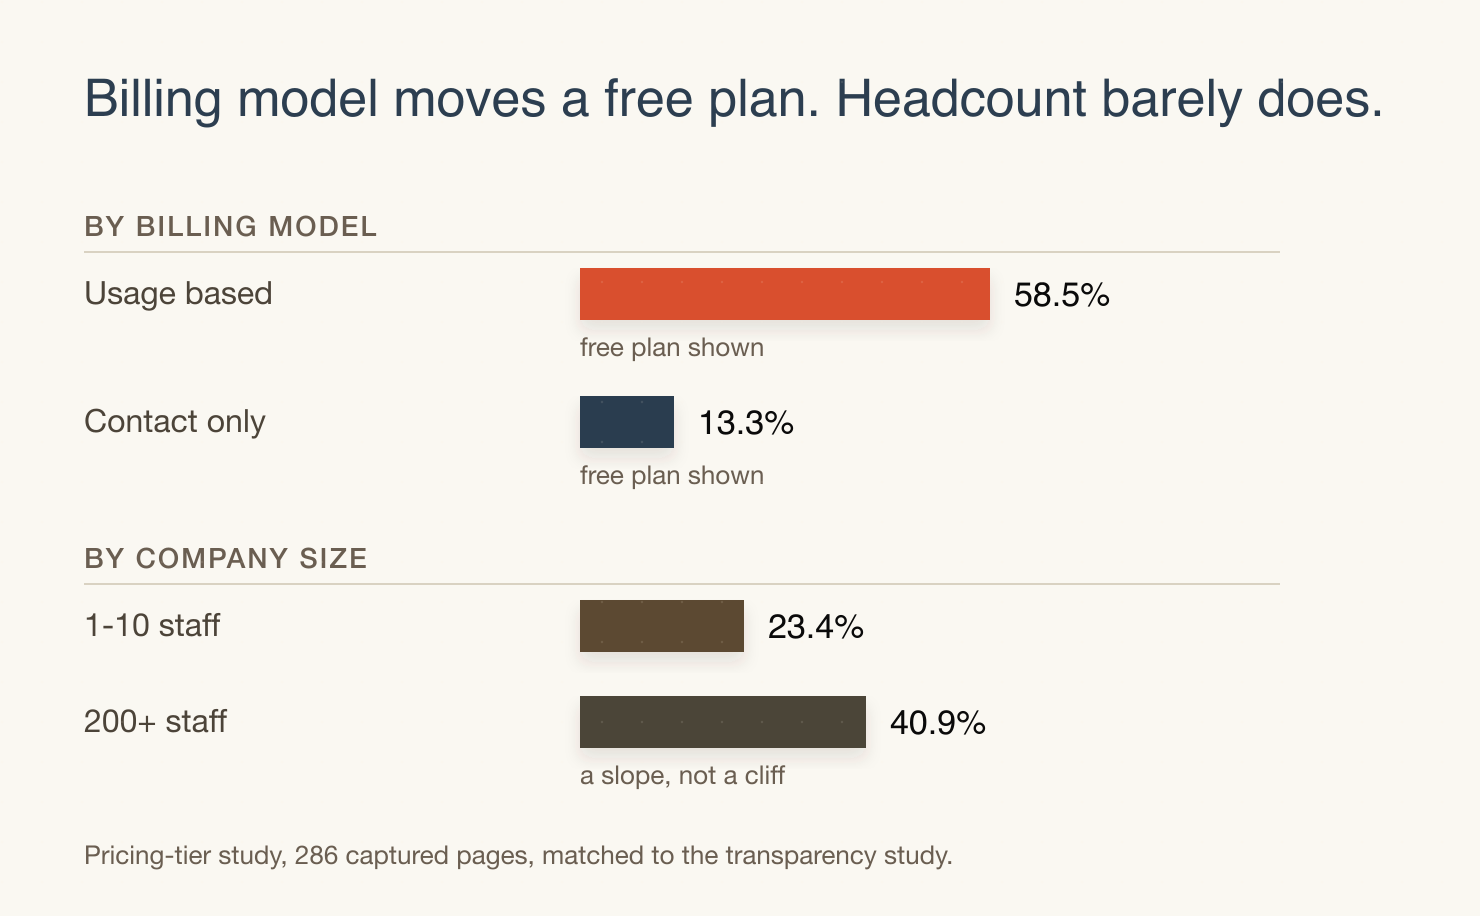
Two numbers belong in a pricing review. Usage-based vendors run free plans at 58.5%. Contact-only vendors run them at 13.3%.
Meanwhile the spotlight rate, meaning the tier a page visually pushes, sits at 28.4%, and 46.8% of structured tier pages name an Enterprise tier.
Read those as a set. Your free plan is a consequence of how you charge. The tier you promote is a marketing decision. Neither one is a fact about the buyer, and neither tells a reader what they will actually pay.
The full pricing-tier study runs on 286 captured pricing pages, and the ecosystem study on 479.
Trust proof beats the review badge, three and a half times over
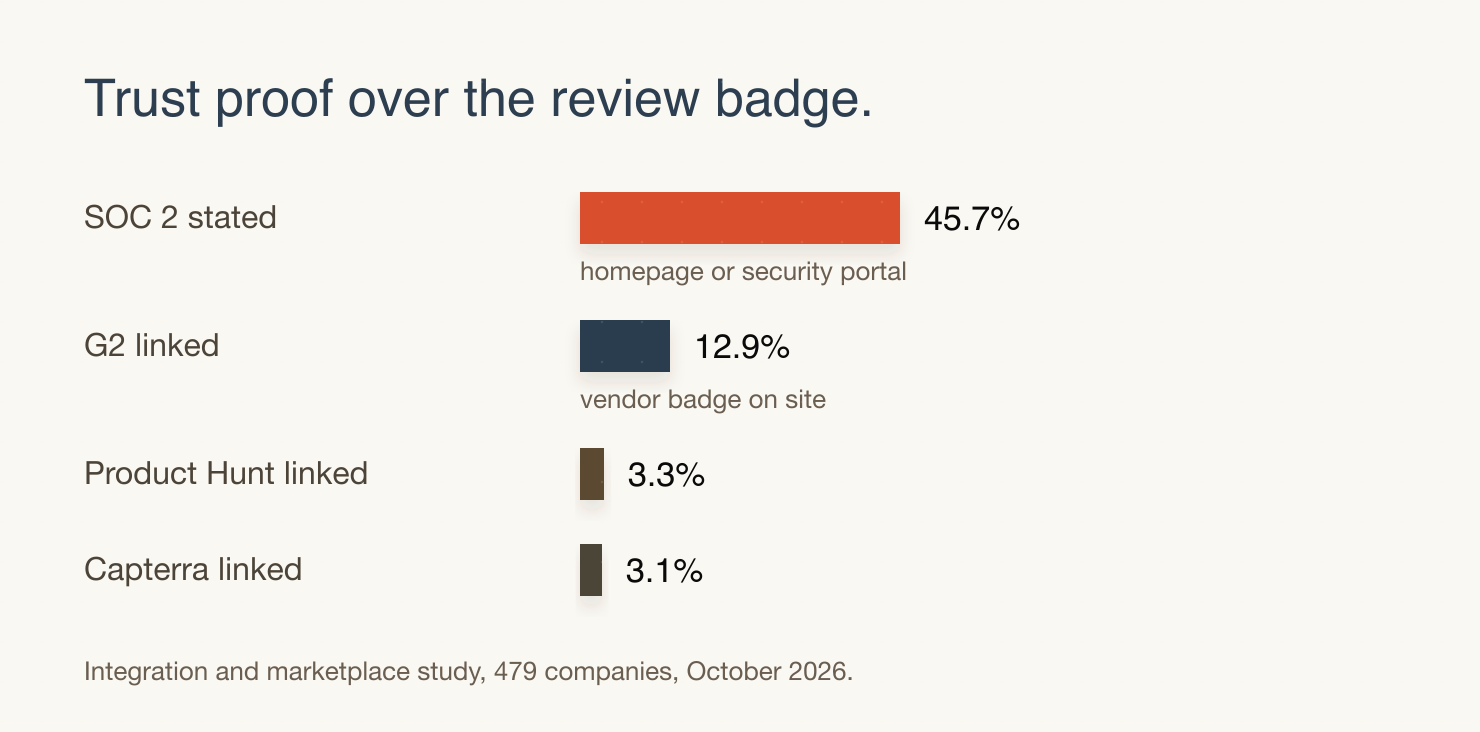
Across the same 479-company frame, 45.7% of companies highlight SOC 2 somewhere on their homepage or security portal.
Twelve point nine percent link to G2. Three point three percent link to Product Hunt. Three point one percent link to Capterra.
Roughly three and a half to one, then, in favour of a security control over a review badge, in a cohort that is not trying to make the point.
The reading is not that review badges are worthless. Buyers seem to treat them as decoration and treat security posture as diligence. If you are spending design effort on a five-star review strip, that effort would go further on a named trust centre with a real scope.
It also answers a question the badge cannot settle. A review score says somebody was satisfied. A security page says what was assessed, by whom, over what period.
What to publish, in the order that removes objections
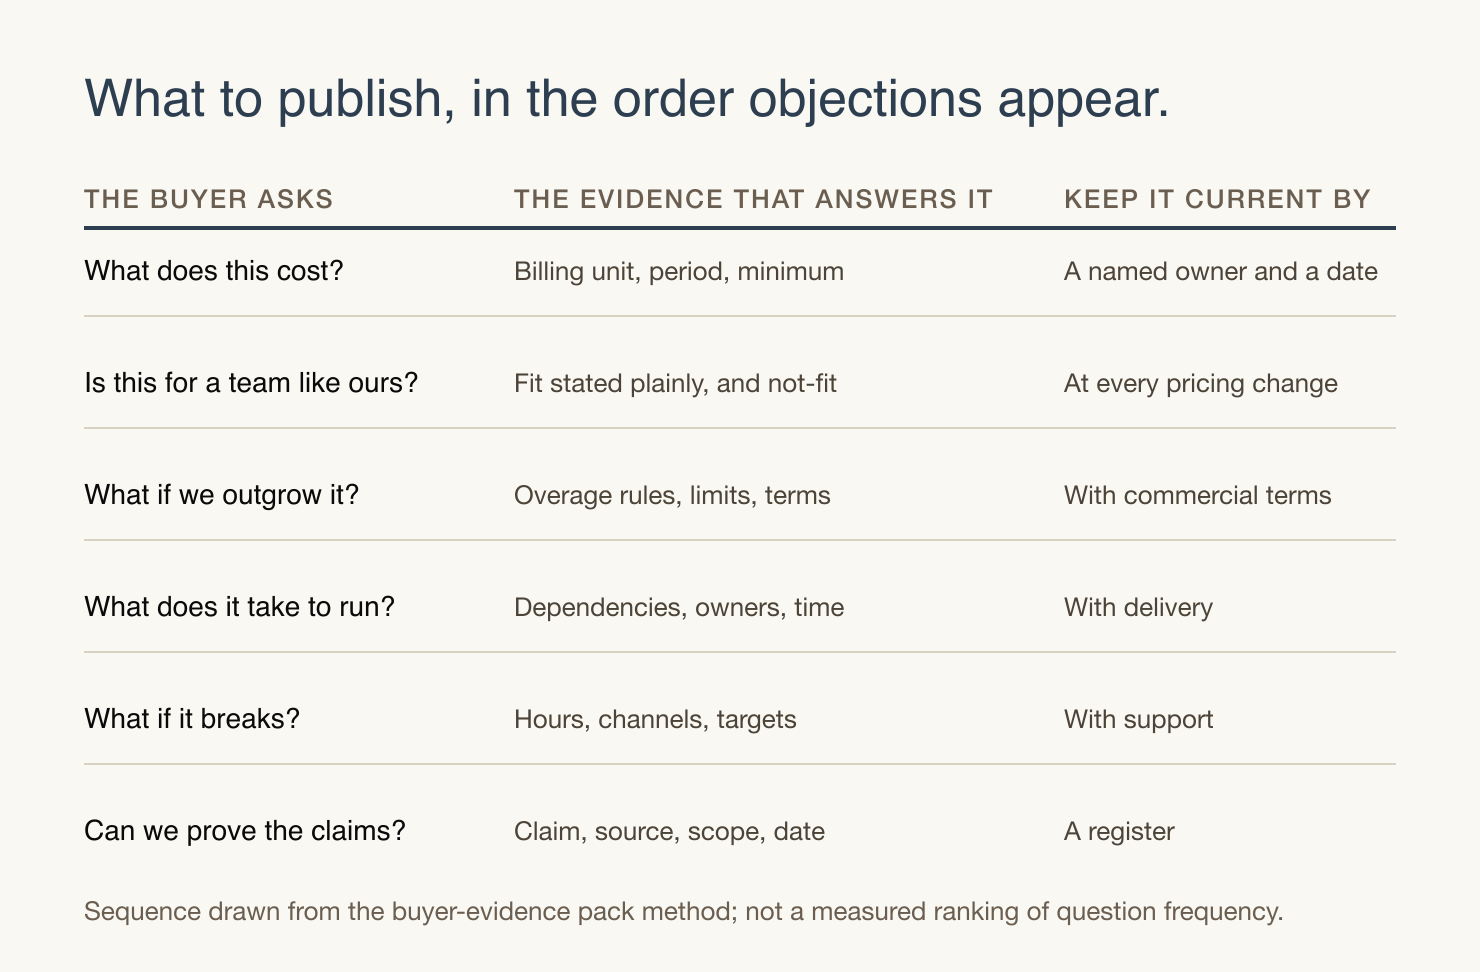
None of this is a template. It is the sequence that removed objections fastest when we looked at the evidence, arranged the way a buying committee actually reads.
| Question the buyer asks | The evidence that answers it | Keep it current by |
|---|---|---|
| What does this cost? | Billing unit, period, minimum commitment, what sits outside the subscription | Naming an owner and a review date |
| Is this for a team like ours? | Fit stated plainly, including who should not buy | Revisit at every pricing change |
| What happens if we outgrow it? | Overage rules, limits, plan-change terms | With the commercial terms |
| What does it take to run? | Named dependencies, who does them, roughly how long | With the delivery team |
| What if it breaks? | Support hours, channels, response targets, escalation route | With the support owner |
| Can we prove the claims? | A claim, its source, its scope, and its verification date | A register, not a paragraph |
The last row is the one most teams skip. It is also the row that decides whether your own sales team can use the page.
One more belongs in most mid-market packs: the systems you integrate with, and which of them are supported rather than merely possible. That removes a whole category of late-stage objection. In our ecosystem study, 68.3% of per-seat vendors named at least one external ecosystem at all, rising to 73.2% at 200+ employees. Integration depth tracks the billing model more than it tracks size. Your integration story is a consequence of how you charge.
Say who it is not for
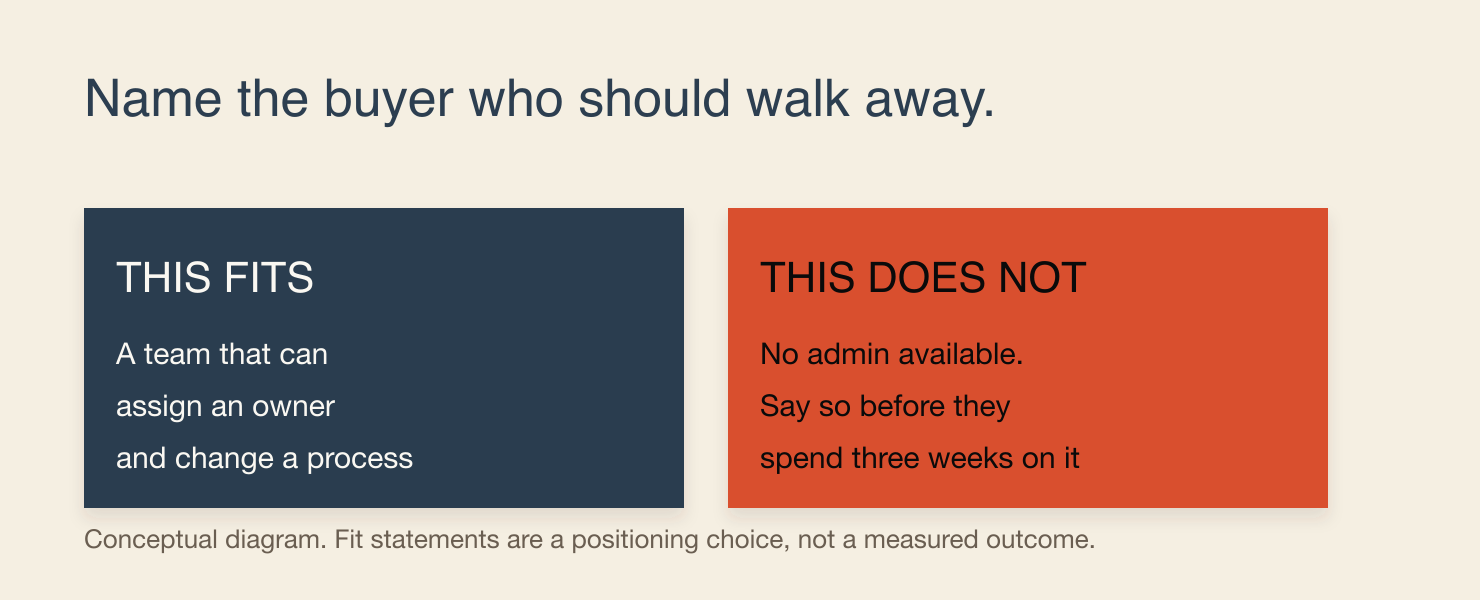
Every page on this list gets more useful when it names the buyer who should walk away.
This is a positioning decision, not politeness, and it happens to reduce support load and shorten a bad deal. A team that needs a dedicated administrator is a poor fit for a company that cannot assign one. Put that on the page and the wrong champion self-selects out. Better that than three weeks of them championing it internally.
It also reads as confidence to the buyer who is still deciding. A page that claims to suit every buyer gives a careful evaluator nothing to hold onto.
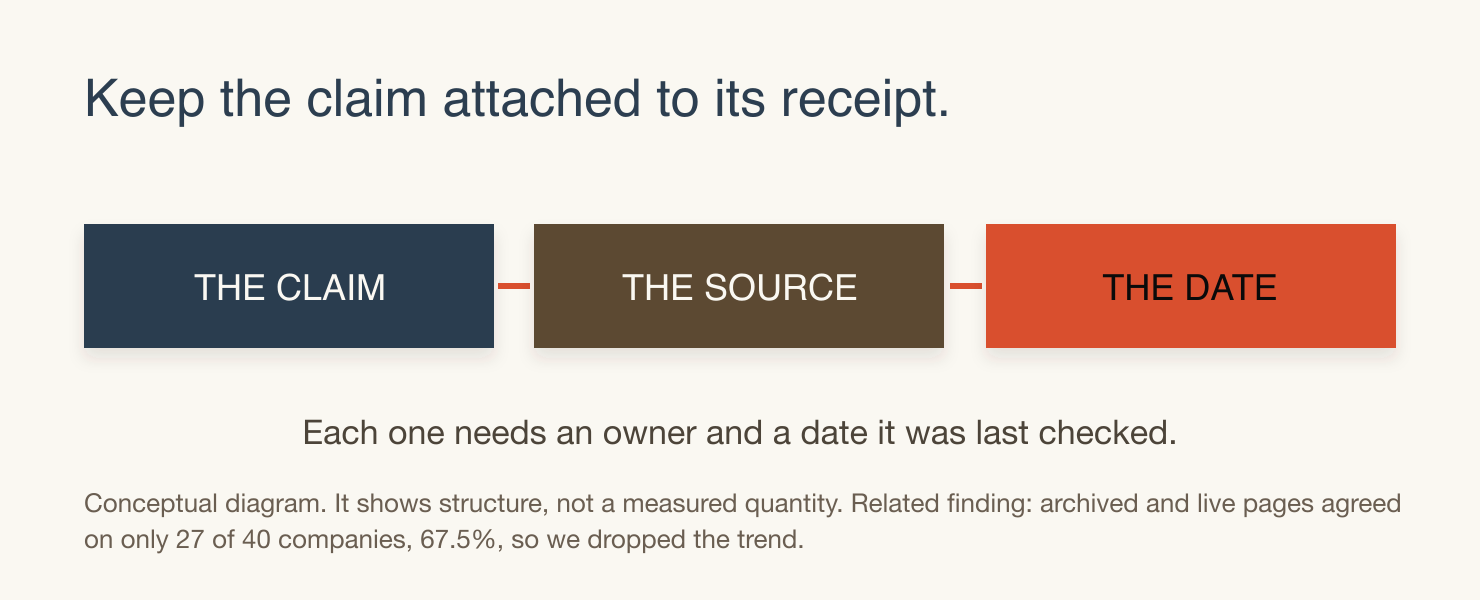
Keep claims attached to their receipts
A page that is easy to cite is a page where every number can be traced.
We hit a similar limit while running the case-study index. An archived page and a live page agreed on only 27 of 40 companies, 67.5%. That was too little to support a trend, so we dropped the trend.
We mention it because it is the right instinct applied against ourselves. The page that gets quoted is the page where somebody can tell which number came from where, and how old it is.
Give the evidence a date. Keep the link on the words that describe the source. When a source moves or expires, the sentence should say who needs to rewrite it.
A verified number ages. An unverified one just goes wrong quietly.
How confident we are
Every figure here comes from one crawl of 479 YC-backed B2B software companies in October, and each finding has its own limit. Naming them matters more than the headline, because the headline is what gets quoted.
The pricing split is the softer number. Our hand-coded fixture matched pricing-basis classification on 22 of 26 pages, 88.5%, below the 95% target we set ourselves. The transparency split, meaning published, contact-only, page-without-price and no-page, matched on 25 of 26, or 96.2%. Quote the second one if you are quoting one.
The 90 companies with no pricing page we could find are a discovery limit, not a finding about those companies. Some certainly have a page our crawler did not reach. That is why 49% of all 479 publish a price and 60.2% of the 389 with a findable page do.
The comparison-page figures come from a different crawl with 49 fetch failures excluded rather than counted. We classified titles rather than judging whether a page was any good, so nothing here says a competitor's comparison page is accurate.
And the whole sample is venture-backed companies weighted toward recent YC batches, matched to our pricing-transparency study. It describes that population, not the B2B software market, and not your category.
Wrap-up
The uncomfortable reading of this research is not that your market hides things from buyers. Most of it behaves reasonably. Half of it will not give you a price, because a price would cost more than it earns.
The opportunity is narrower, and more useful. In a category where 69.1% of vendors publish nothing, and where 73% of published prices are not the unit a buyer will assume, the vendor who states their unit, their limits and their not-fit cases plainly is doing something unusual. It costs nothing in distribution.
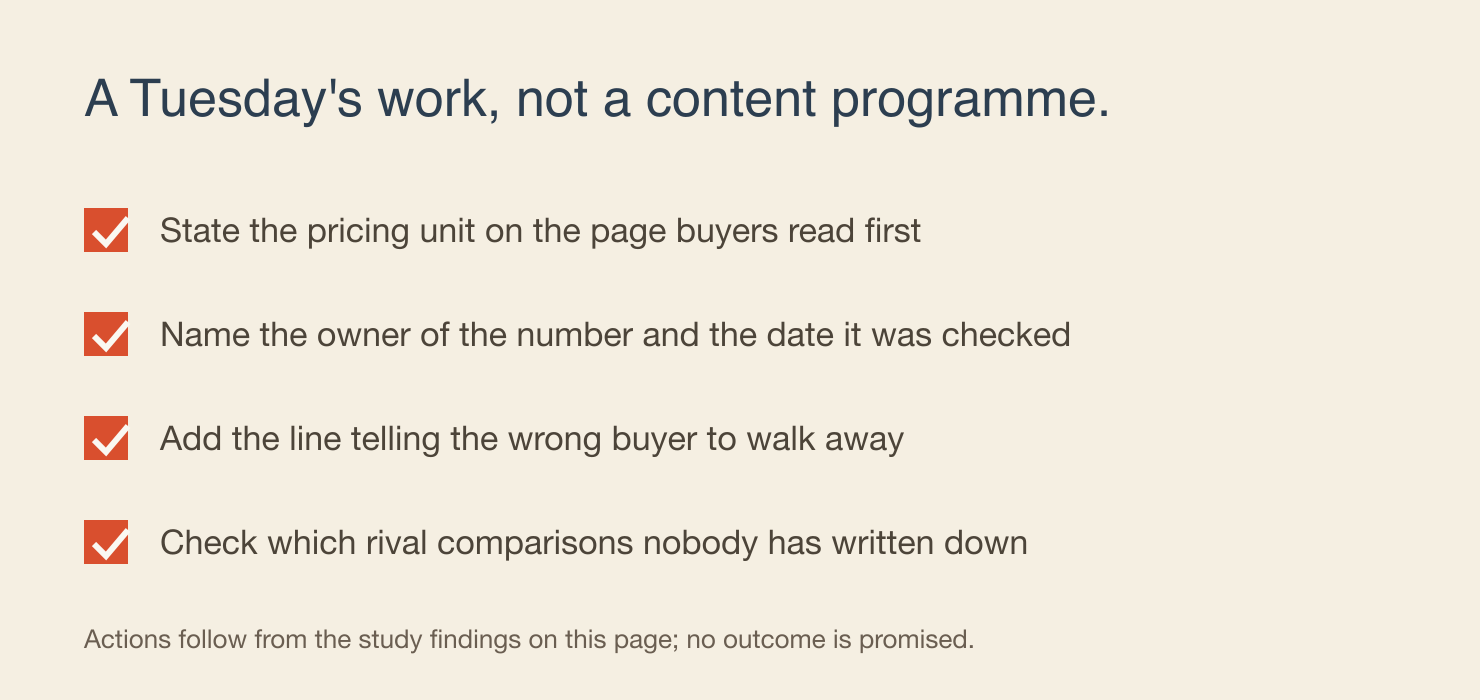
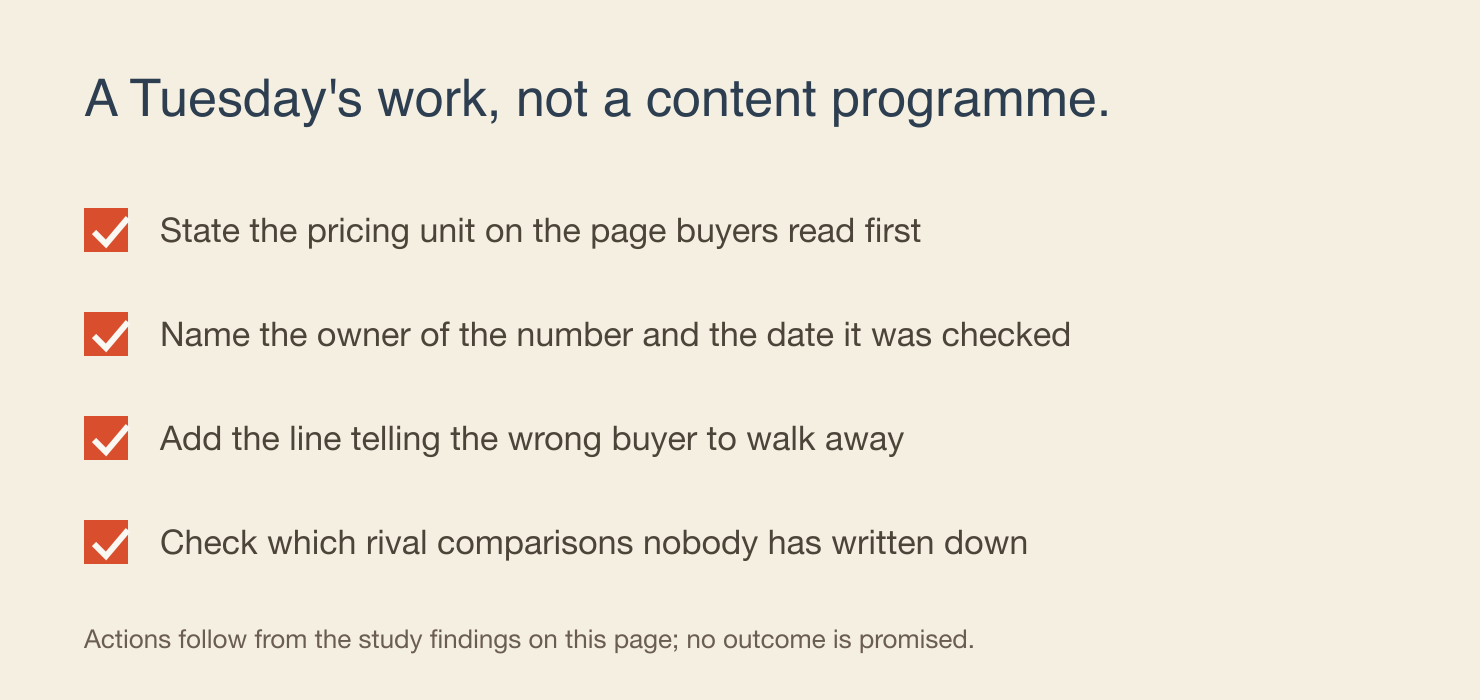
You do not need a content programme to start. Publish the pricing unit on one page. Name the owner of the number. Add the not-fit line. Then check what your competitors have not written down.
That is a Tuesday's work. It is also the same work a twenty-page comparison library is built from.
Want to see whether your own pages carry the facts?
Start with the page a buyer is most likely to read before they contact you, then scan it for the gaps that cost you the shortlist.