

Let me ask you a question. If you could sell your product to everyone in the world who needed it, how big would your market be?
It's a wild thought, isn’t it? That's the essence of TAM - Total Addressable Market. It's the big, bold number every entrepreneur loves to throw around in pitch meetings. But here's the deal: calculating TAM is not about playing with numbers to impress investors. It’s about understanding your business's potential and defining the upper limit of what you could achieve. And let me tell you, while it might look simple on the surface, the real power of TAM comes from the insights it gives when done correctly.
But calculating TAM is often more art than science. Sure, there are formulas and methodologies, but every business has its nuances. In this blog post, we’ll dive deep into understanding how to calculate TAM in a way that’s not only intelligent but nuanced. If you’re tired of basic guides that skim over the real challenges, you’ve come to the right place. So, let’s get started.
Why Is TAM So Important?
Let's be honest. The phrase “Total Addressable Market” can sometimes feel like empty jargon, especially if you’ve heard it thrown around during a flashy product launch presentation. But TAM is important. Let me explain why.
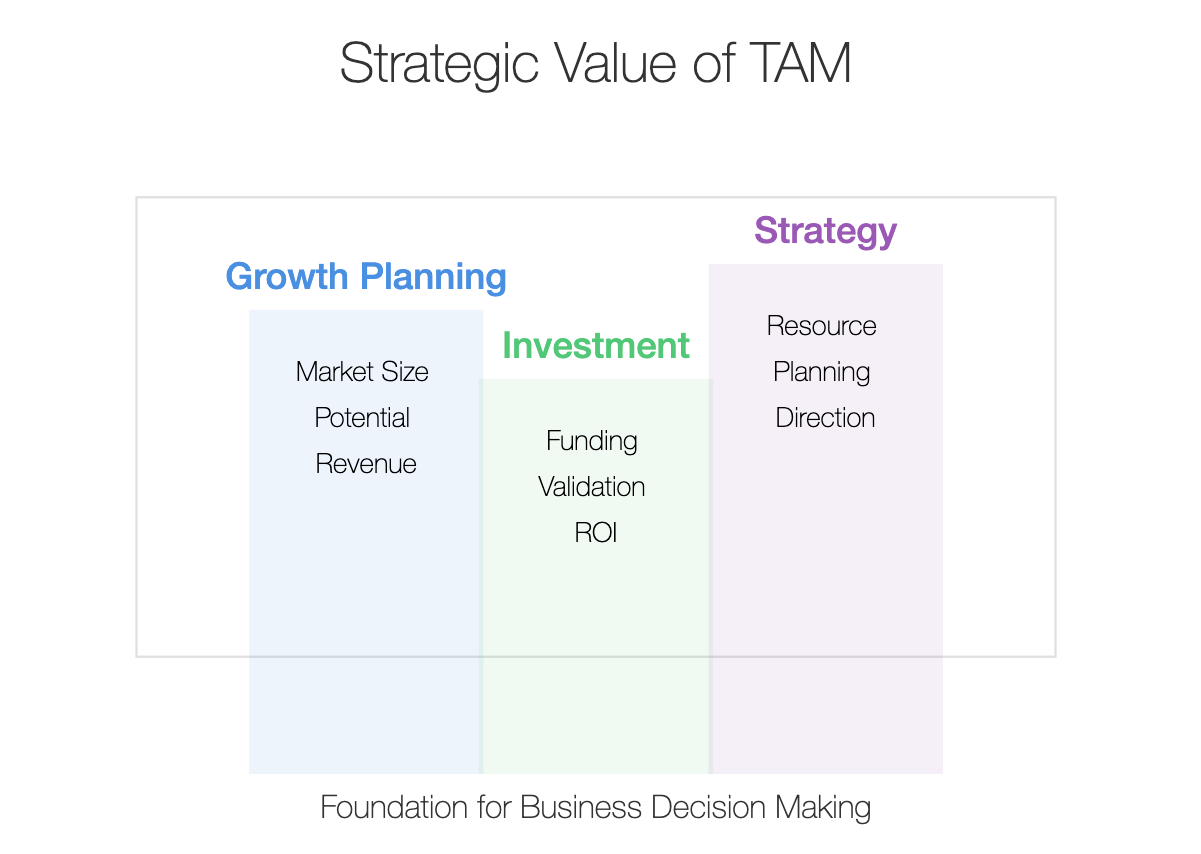
First, TAM helps you determine the potential revenue opportunity if your product or service captures 100% of the market. While hitting 100% is, of course, impossible, knowing that figure gives you the context to think about your market share. If you're talking about gaining 5% of a $2 billion market, that's a very different story than aiming for 5% of a $2 million market.
For us at DataDab, working with companies to build marketing strategies means we constantly need to understand their growth ceiling. Without a clear TAM, growth goals can become a shot in the dark - without a true target to aim for.
Secondly, investors look at TAM to understand if your business is worth the gamble. A high TAM might indicate huge potential, but if it’s not paired with a realistic execution strategy, it’s just wishful thinking. No pressure, but the number you choose could make or break whether your company gets funding or support.
But there’s more. TAM also directly impacts your internal strategic planning. When you know the size of your market, you can better plan the resources, staffing, and initiatives required to realistically seize it. It’s about building the roadmap.
The Three Approaches to Calculating TAM
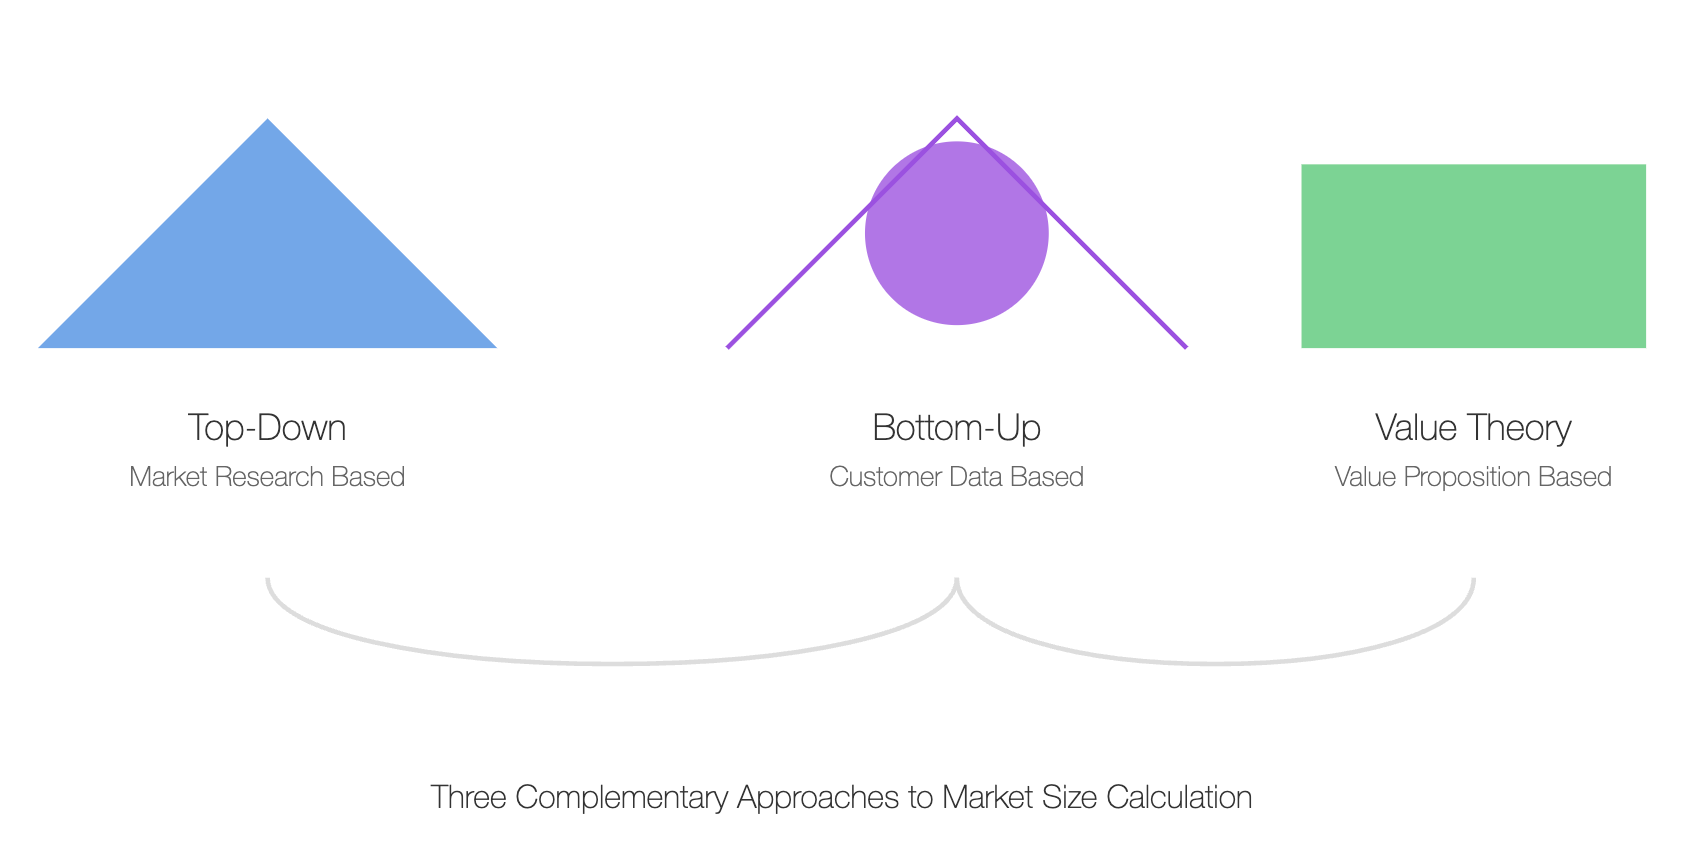
There are three commonly used methods to calculate TAM, and the method you choose really depends on your business model and available data. These methods are:
- Top-Down Approach
- Bottom-Up Approach
- Value Theory Approach
Let's look at each one, one by one.
1. Top-Down Approach
The Top-Down Approach starts from macroeconomic indicators. It’s like standing on a mountaintop and surveying the entire landscape. This involves using market research reports, government databases, or insights from big market research firms like Gartner or Forrester.
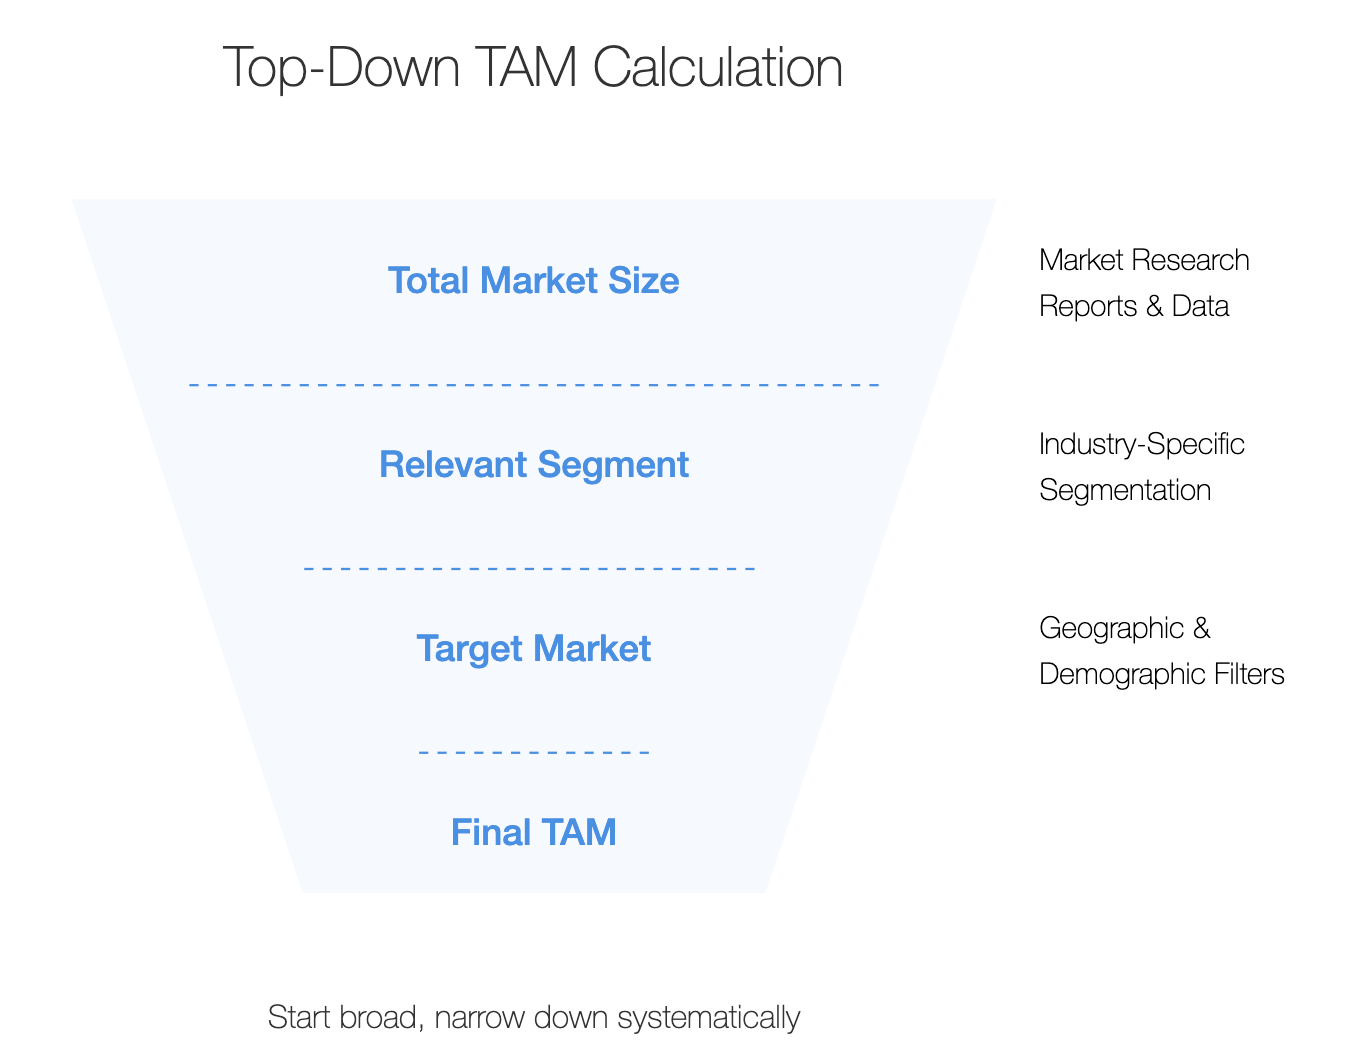
Sounds easy, right? You grab a report, get a big number, and adjust it down based on your segment or niche.
The issue here? You’re often dealing with broad data, which lacks nuance. The problem with the Top-Down Approach is that these broad reports sometimes paint an overly optimistic picture. For example, if you're calculating TAM for a SaaS product aimed at dental practices, starting from a general “healthcare industry software” report might overestimate your market.
Use this approach with caution, and supplement it with localized and niche data when you can. Top-Down is quick, but it’s rarely precise.
2. Bottom-Up Approach
Now, the Bottom-Up Approach is my personal favorite because it's the most rooted in reality. This approach starts with your actual data - like what a customer spends on your product - and scales it up to calculate the market potential.
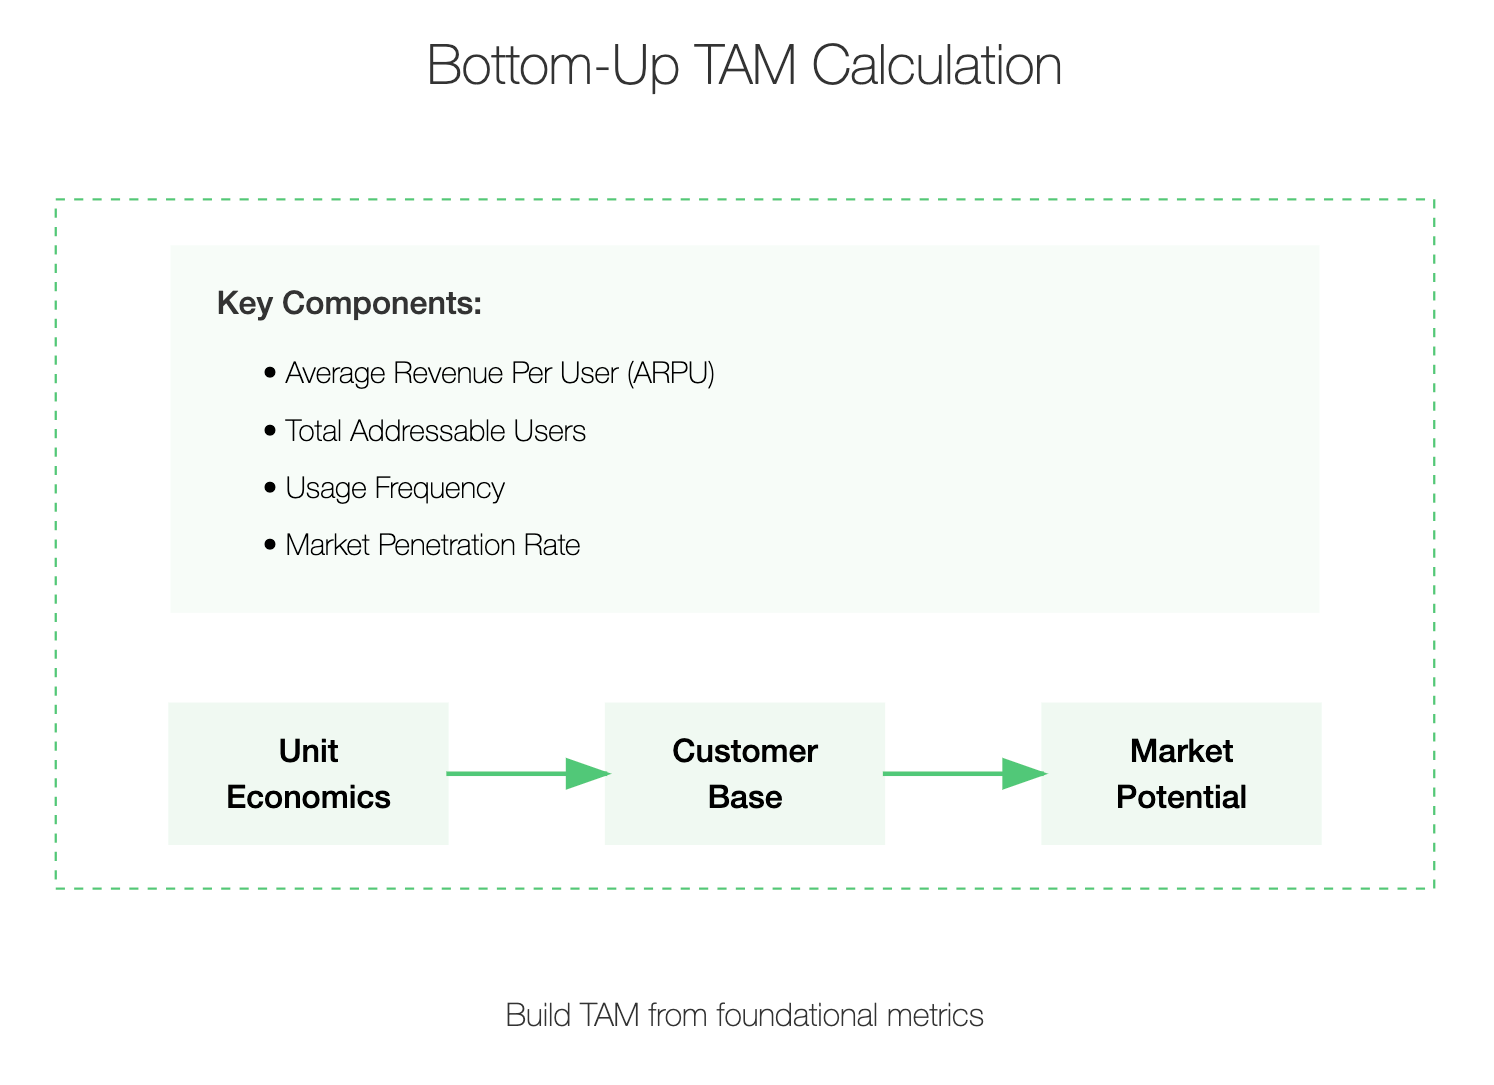
Here’s how it works: Imagine you sell software subscriptions to small businesses for $1,000 annually. You know there are 500,000 small businesses in your country that fit your ideal customer profile. Multiplying the number of potential customers by your annual revenue per customer, you get your TAM. In this case, 500,000 businesses times $1,000 gives you a $500 million TAM.
This method is more nuanced because it relies on real purchase behavior and lets you layer in additional insights. For example, you could adjust for market saturation or adoption rate, giving you an even more realistic view of the opportunity.
But, there’s a challenge. You need good data. Without accurate insight into customer count or reliable customer spending data, your TAM can still veer off course.
3. Value Theory Approach
The Value Theory Approach is the most sophisticated, and dare I say, elegant. This approach calculates TAM based on the value your product delivers to your customers.
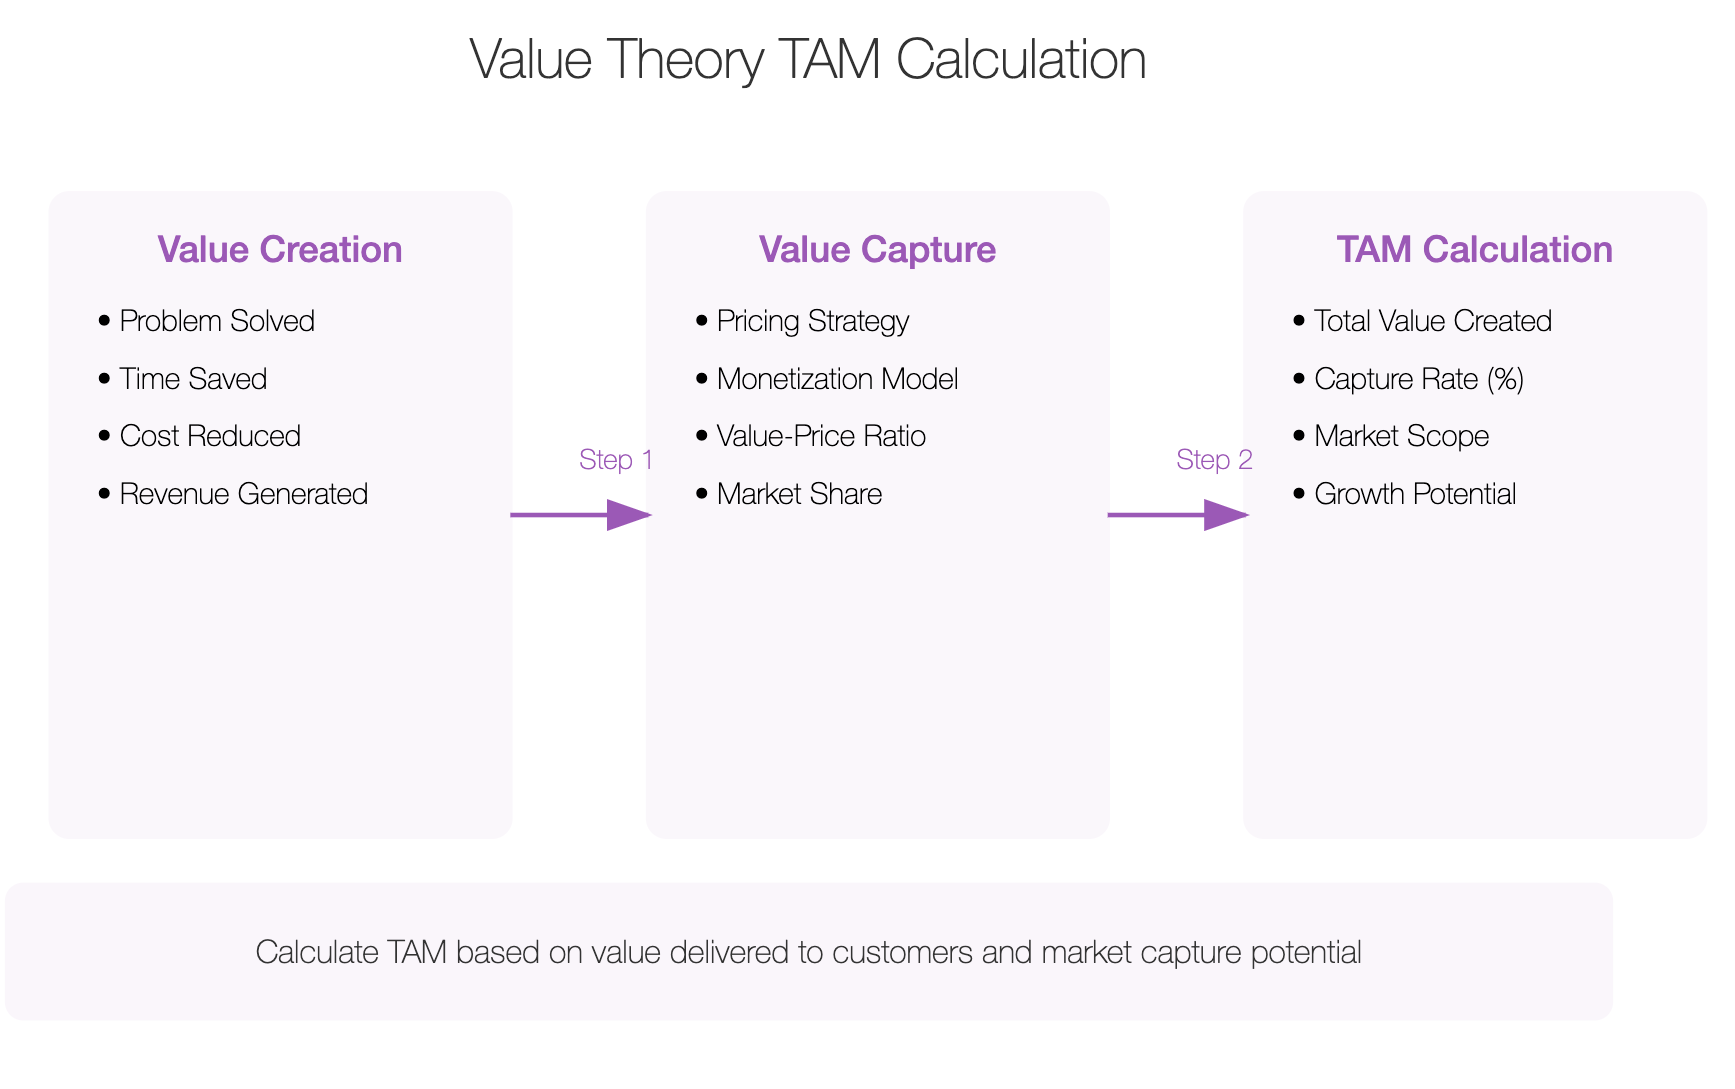
Let’s break it down. If your software saves a business $10,000 annually, you may choose to price your software at $2,000 per year, which represents a good value-to-cost ratio for your customer. You then calculate your TAM by multiplying the value proposition’s appeal across your total customer base.
This approach requires deep insight into how your solution impacts your customers. It’s not just about broad strokes; it's about the granular, unique advantages you bring and the economic value attached to those benefits. It’s also riskier because getting it wrong could mean fundamentally misjudging your market size.
Let's Look at Real Examples
Imagine you run a platform for pet care services. You want to understand your TAM for a new marketplace connecting pet owners to vetted pet service providers - trainers, groomers, sitters, and vets.
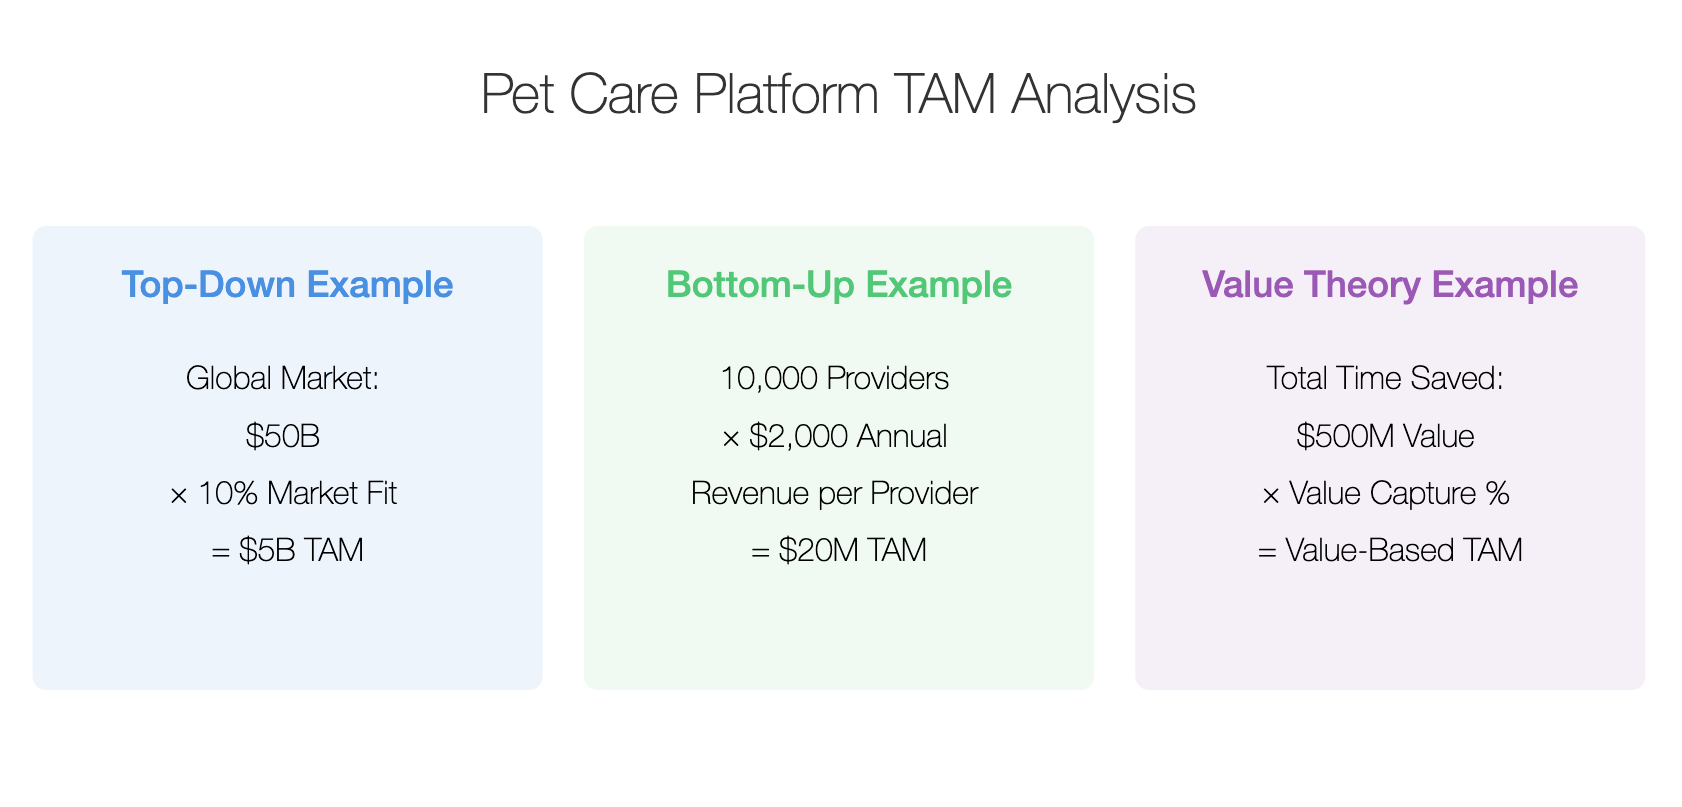
- With a Top-Down Approach, you could use industry reports indicating that the pet services market is worth $50 billion globally. You take that number and say, “Okay, let’s assume 10% of that market aligns with our model.” So, you estimate a TAM of $5 billion.
- For a Bottom-Up Approach, you would examine local pet service data. If there are 10,000 pet service providers you could onboard, and you expect each one to contribute $2,000 in transaction volume annually, you end up with a TAM of $20 million.
- A Value Theory Approach might involve understanding the customer’s pain points. If pet owners collectively save $500 million in hassle and wasted time through your platform, you peg the TAM based on the slice of that value you can capture.
How to deal with the details
Calculating TAM is more nuanced than just crunching numbers. Think of it as an exercise in understanding market dynamics and customer behavior.
- Market Fragmentation: If the market is very fragmented, a high TAM might still be difficult to address. You could have millions of potential customers, but if they’re scattered across many geographies or demographics, acquiring them profitably might be tough.
- Customer Adoption Rates: TAM assumes that every potential customer will buy from you. But that’s never the case. Understand the adoption curve for your industry. Are you in a space that’s traditionally slow to adopt new technology? Factor that in.
- Price Sensitivity: What’s the elasticity of your pricing? TAM is ultimately tied to what customers are willing to pay. You might have a service that theoretically fits 10,000 customers, but if your pricing model doesn't align with their willingness to pay, the true addressable market shrinks.
Industry-Specific Insights
Different industries require different angles when calculating TAM. Let’s explore some nuanced examples from various industries.
SaaS Products
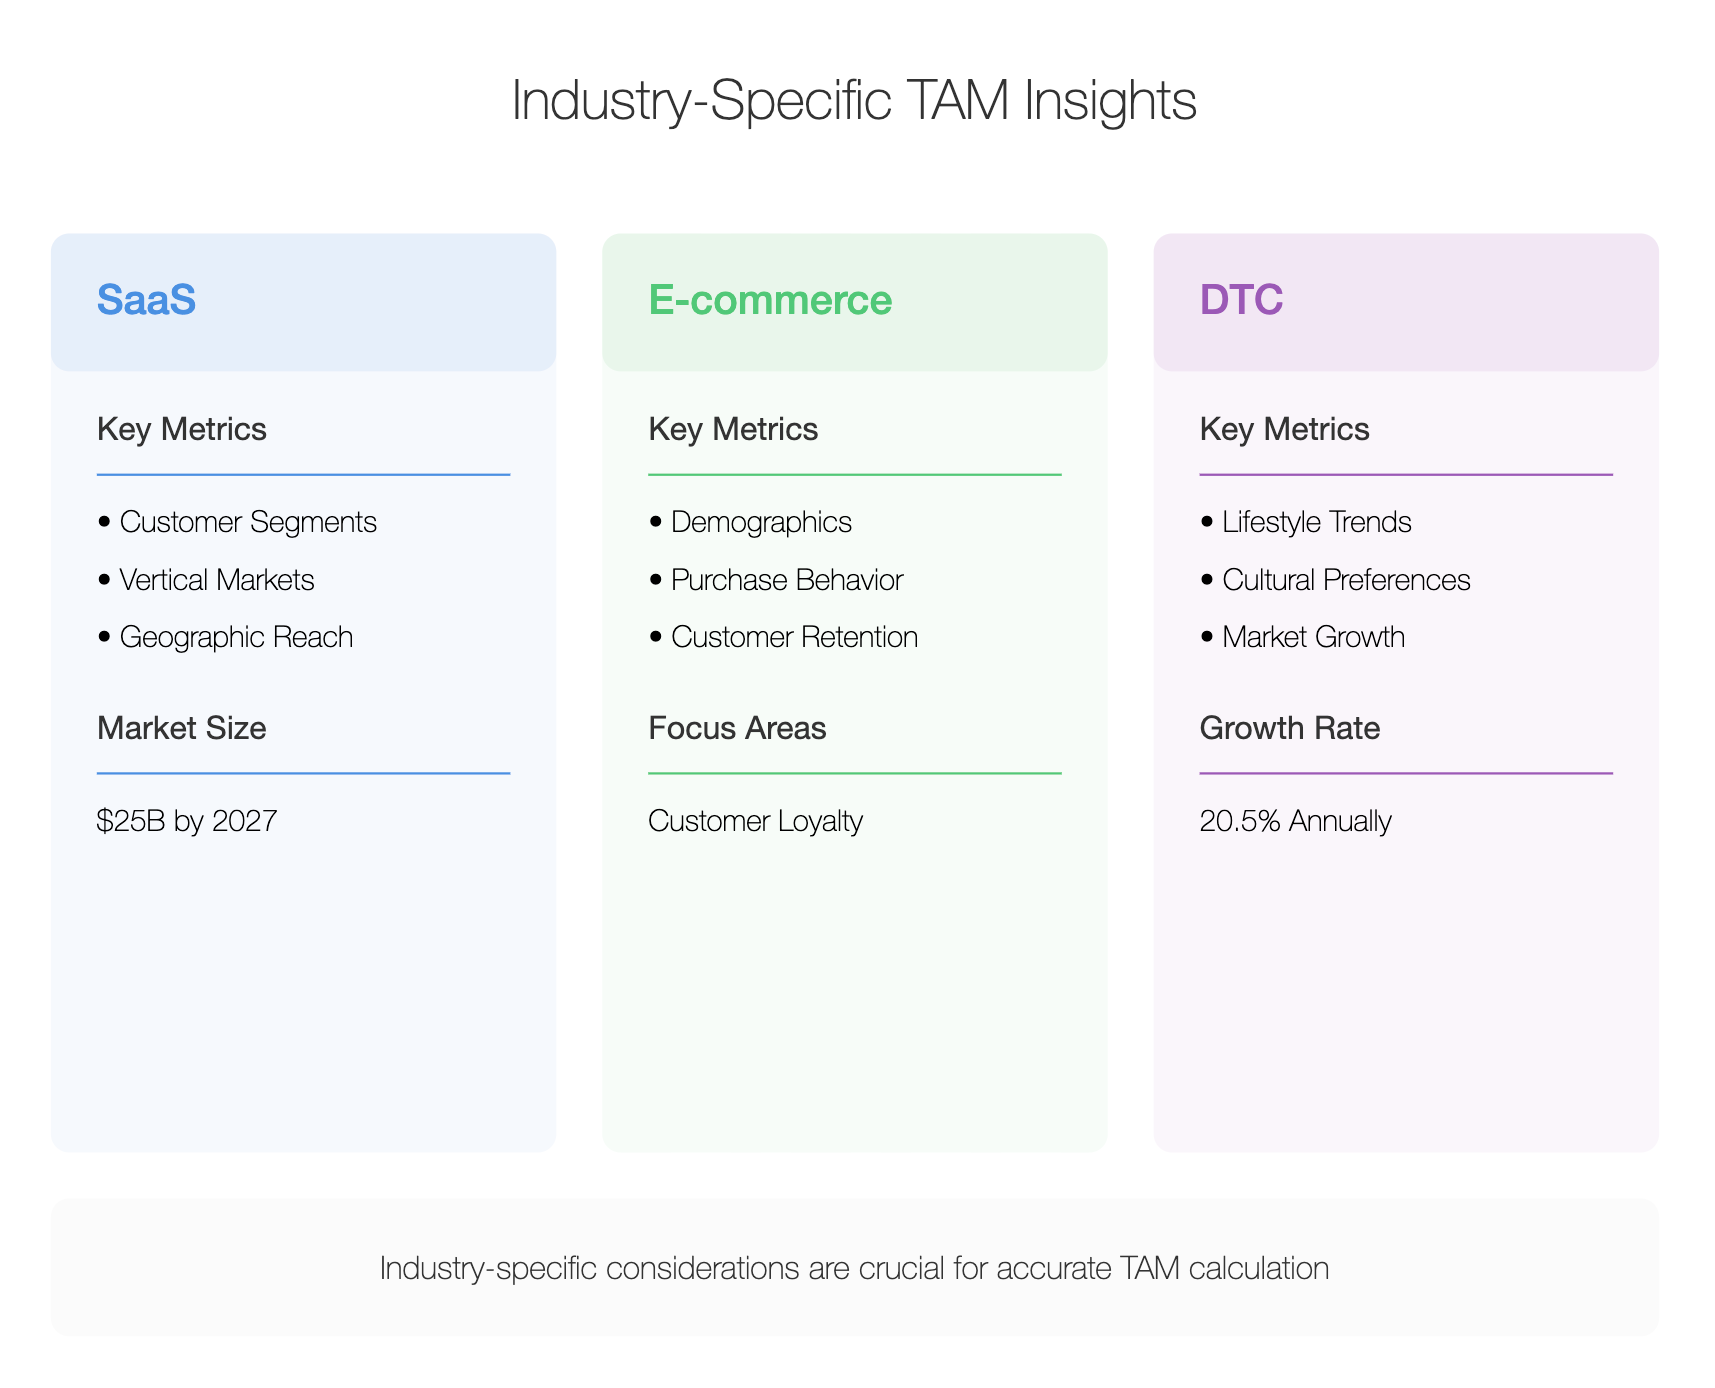
For SaaS companies, particularly B2B, TAM is often based on customer segmentation. Instead of looking at broad software spending, a successful TAM analysis will look at company size, industry vertical, and geography. If you're providing marketing automation for dental clinics, you need reliable data on how many dental clinics exist and how many of them have budgets for marketing automation.
Statistical Insight: According to Statista, the marketing automation software market will reach $25 billion by 2027. However, not all of that is accessible to a small niche player. If you specifically target a segment, like dental clinics, your TAM will be a tiny slice of that $25 billion.
eCommerce
For eCommerce businesses, TAM calculations can be heavily driven by demographic data. You might be selling niche pet products - let’s say sweaters for teacup dogs. Instead of looking at all pet spending, you’ll want to use data that tells you the number of teacup dog owners in your target region.
Actionable Insight: Customer loyalty is also key here. Your TAM might be high, but if customer retention is poor, then even capturing a decent market share could prove unsustainable.
Direct-to-Consumer (DTC)
For DTC brands, TAM is often linked to lifestyle trends. Are you launching a new organic Ragi product? Instead of looking at the broad organic foods market, consider narrowing down to regional preferences, cultural trends, and current dietary habits.
Interesting Fact: According to a report from Mordor Intelligence, the organic food market in India is growing at 20.5% annually, but growth isn’t uniform. Metropolitan cities have much higher growth due to increased health awareness.
Mistakes to Avoid When Calculating TAM
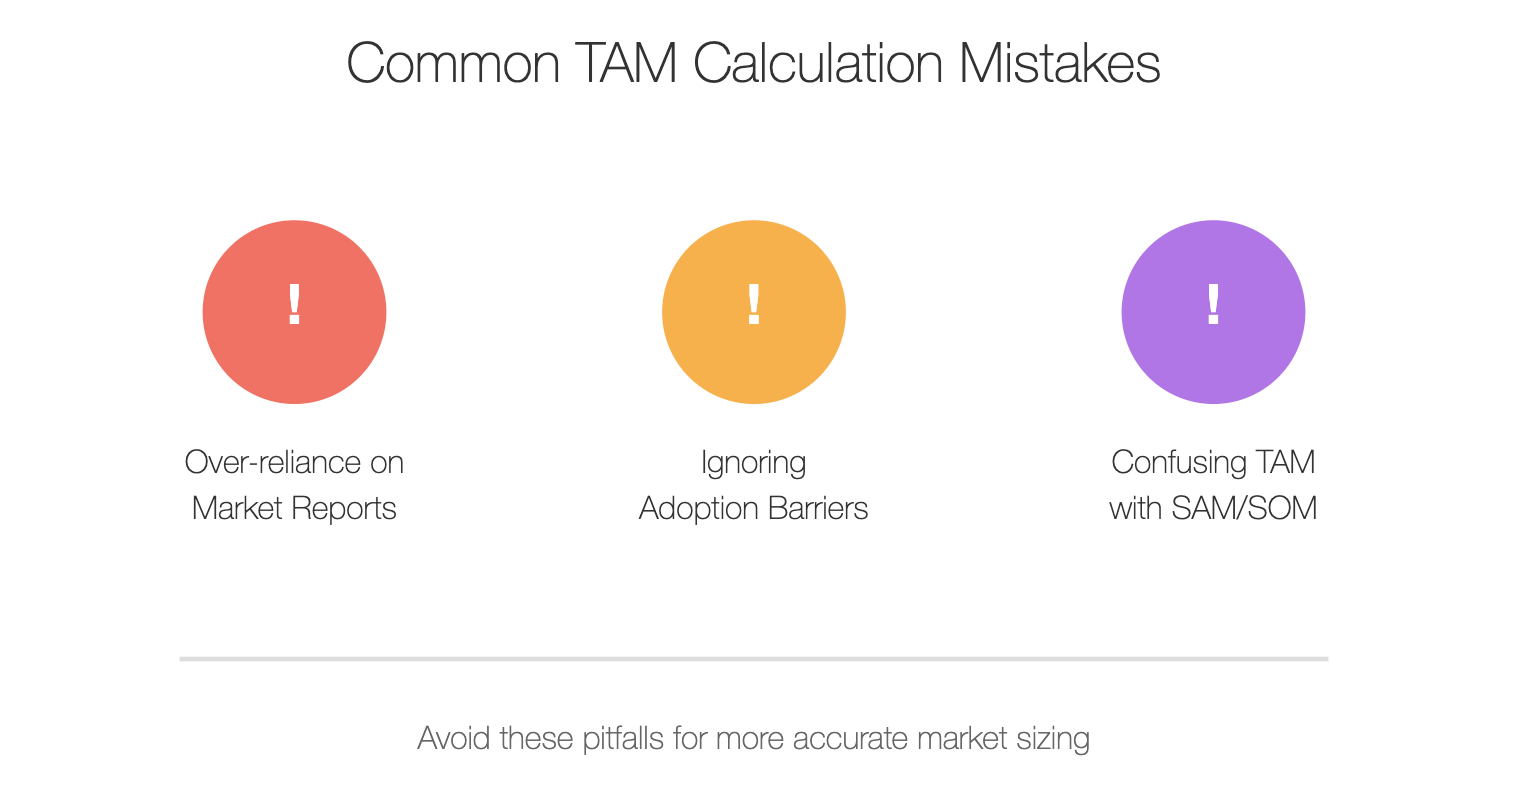
- Over-reliance on General Market Reports: Don't make the mistake of taking a broad market report, chopping a portion, and calling it your TAM. The real work lies in adjusting that data to your niche.
- Ignoring Adoption Barriers: You might have a great product, but if the adoption barrier is high, your accessible market could be much smaller.
- Confusing TAM with SAM and SOM: While TAM represents the entire universe of possible customers, SAM (Serviceable Available Market) and SOM (Serviceable Obtainable Market) bring things down to Earth. SAM is about the portion of TAM that fits your target customer criteria, and SOM is the subset you can realistically acquire.
Closing Thoughts
Calculating TAM is a mix of art, science, and a bit of common sense. It’s a crucial number, but it's not the only number. At DataDab, we see TAM as a directional beacon rather than a magic bullet. It’s the foundation, but your Serviceable Market, Customer Acquisition Costs, and Retention Metrics are what will define your success.
Remember, TAM is the dream - the perfect vision of everyone who could ever want or need what you’re selling. But successful businesses are built on more than dreams. They’re built on understanding exactly how much of that dream you can capture, and then figuring out how to do it efficiently and sustainably.
So go on, calculate your TAM, but make sure you look beyond that big number. Get into the nitty-gritty, understand your market's dynamics, and use that understanding to inform your decisions every step of the way. Your market is out there, waiting. Now, it's time to find it.
FAQ
1. What is the main purpose of calculating TAM?
Calculating TAM helps determine the maximum potential revenue if every possible customer purchased your product. It is critical for strategic planning, setting realistic growth targets, and convincing investors about the market opportunity.
2. How do I decide which approach to use for calculating TAM?
The choice depends on your business model and the data you have. Use the Top-Down approach if you have broad industry data, the Bottom-Up if you have granular customer data, and Value Theory if your product's unique value is clearly quantifiable.
3. What are some reliable data sources for a Top-Down Approach?
Use industry reports from reputable market research firms such as Gartner, Forrester, Statista, or government databases. These provide large-scale market insights but should be adjusted for your niche to maintain precision.
4. What is a key advantage of the Bottom-Up Approach?
The Bottom-Up Approach uses actual sales data and specific market details, making it more accurate. By scaling real customer purchases and potential counts, it provides a more realistic and practical estimate of market size.
5. How do I use Value Theory effectively?
Understand the specific economic value your product delivers, like cost savings or productivity gains for customers. Then, calculate TAM based on the potential value multiplied across your customer base. Ensure your value assumptions are verified through market research or customer feedback.
6. Can TAM estimates change over time?
Absolutely. As market conditions evolve, such as customer behavior changes or new competitors entering the field, TAM should be recalculated periodically to reflect updated market potential and business scenarios.
7. What are common mistakes when calculating TAM?
Mistakes include over-relying on general market reports, failing to adjust for niche specifics, ignoring barriers to adoption, and confusing TAM with SAM (Serviceable Available Market) or SOM (Serviceable Obtainable Market).
8. How can market fragmentation impact TAM accuracy?
If the market is fragmented across different demographics or regions, your TAM might be theoretically large but challenging to address practically. A fragmented market requires a more targeted approach to assess the true size you can capture.
9. How does customer adoption rate factor into TAM?
TAM represents the total possible market, assuming every customer will buy from you. Realistically, understanding adoption rates helps adjust TAM to a more practical figure - since not every customer will embrace your solution due to various barriers.
10. Should I calculate SAM and SOM along with TAM?
Yes, calculating SAM and SOM provides more actionable insights. While TAM defines the total market, SAM refines it to the addressable segment, and SOM represents the realistic portion you can acquire. This layered approach guides better strategic decisions for growth.