
"Analytics pays back many times over by driving growth, retention, and efficiency."
- Aaron Levie, Co-Founder of Box
Free trials are a critical part of the customer acquisition process for many SaaS companies. Offering a free trial allows potential customers to experience your product firsthand before committing to a purchase.
However, simply having a free trial is not enough. You need to optimize the trial experience to convert as many free users into paying customers. This is where product analytics comes in. By tracking and analyzing user behavior during free trials, you can gain insights to improve your onboarding flows and increase conversion rates.
In this essay, I'll walk through how to implement analytics to optimize your SaaS free trial strategy. We'll cover:
- Tracking activation and engagement during trials
- Analyzing conversion funnels
- A/B testing onboarding flows
Tracking Activation and Engagement
The first step is understanding how well your free trial setup is working. This requires tracking key activation and engagement metrics.
Activation refers to whether new users are able to successfully get started with your product after signing up. Engagement tracks how often and deeply users interact with your product during the trial period.
Here are some key metrics to monitor:
Activation
- Percentage of signups that pass initial onboarding
- Time to first core action (e.g. creating first document, adding first user)
- Number of help tickets during onboarding
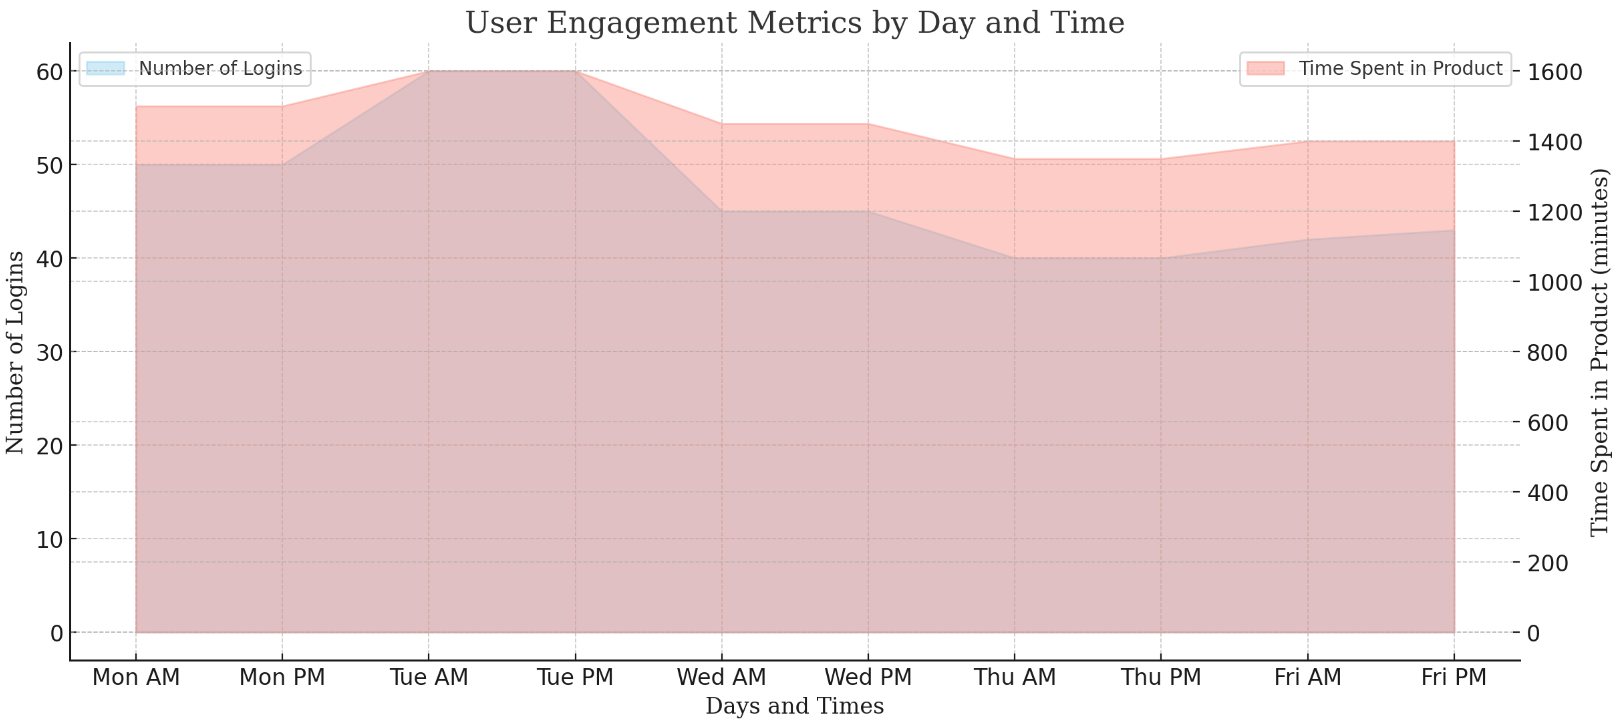
Engagement
- Number of logins per user
- Feature adoption rates
- Time spent in product per visit
- Percentage of 'power users' based on daily/weekly active usage
Monitoring these metrics over time can reveal whether your activation and engagement rates are improving or declining. Big drops may indicate issues with your onboarding flows that need to be addressed.
I recommend tracking engagement by user cohorts based on sign up date. This allows you to analyze metrics over the entire trial period to see how usage evolves.
For example, you may see that usage starts high but declines sharply after 1 week. This could signal that your educational content is not sufficiently supporting users after onboarding.
Onboarding Checklist
Successful onboarding is critical for converting free trial users into paying customers. This checklist covers key metrics to track and guidelines for analysis.
Activation Tracking
- Track signups by source and persona attributes to segment users
- Log user properties like company, industry, and plan interest
- Instrument initial onboarding flows to capture usage data
- Monitor pass rate for getting through onboarding flows
- Log time to first core action like adding data or inviting a user
- Track clicks on different onboarding elements like tutorials
- Capture help requests and questions during onboarding
- Monitor new user NPS and satisfaction with onboarding
Engagement Tracking
- Send usage data to analytics to enable engagement analysis
- Track logins per user per day to assess stickiness
- Calculate time spent in product per visit
- Build custom events for important features like saving a report
- Create funnels for key workflows to analyze drop off
- Segment users by frequency band like daily/weekly/monthly
- Tag power users based on depth of usage not just frequency
- Calculate adoption rates for new features to gauge interest
Cohort Analysis
- Build cohorts of users based on sign up date
- Analyze engagement metrics week-by-week for each cohort
- Compare metrics across cohorts to identify trends
- Highlight cohorts with significant changes in engagement
- Review cohort data by traffic source and persona attributes
- Interview users from impacted cohorts to diagnose issues

Analyzing Funnels
In addition to overall activation and engagement, you need to analyze your conversion funnel.
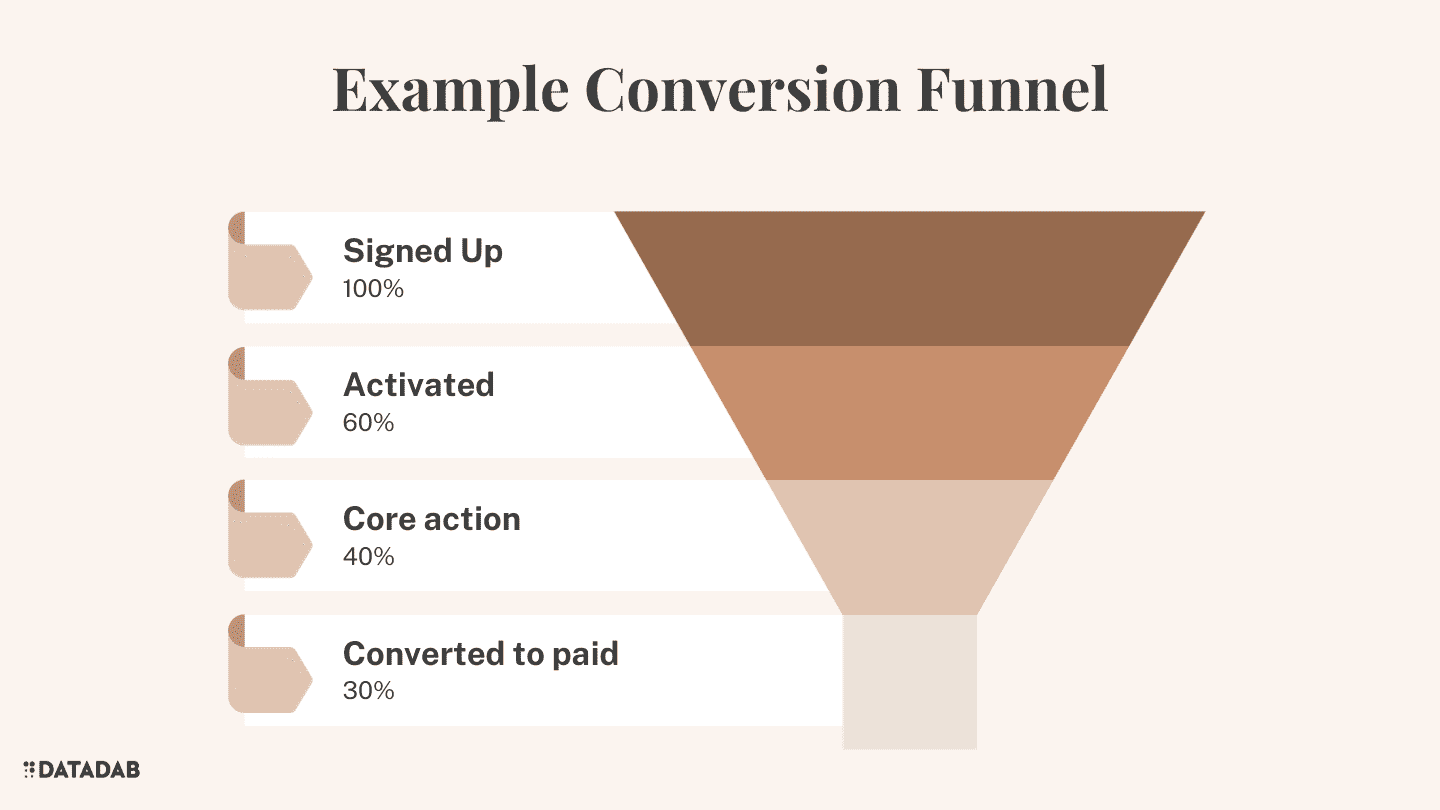
The funnel represents the key steps users go through from initial signup to becoming a paying customer.
For a SaaS free trial, this typically includes:
- Signing up
- Activating
- Experiencing core value
- Converting to paid
By looking at drop off rates between these stages, you can identify leaks in your funnel.
Here's an example funnel for a fictional analytics product called Chartio:
| Stage | Users | Conversion Rate |
|---|---|---|
| Signed Up | 1000 | - |
| Activated | 800 | 80% |
| Generated Charts | 500 | 63% |
| Converted to Paid | 300 | 30% |
This shows high drop off from activating to generating charts, which is a core onboarding step. This indicates an opportunity to optimize.
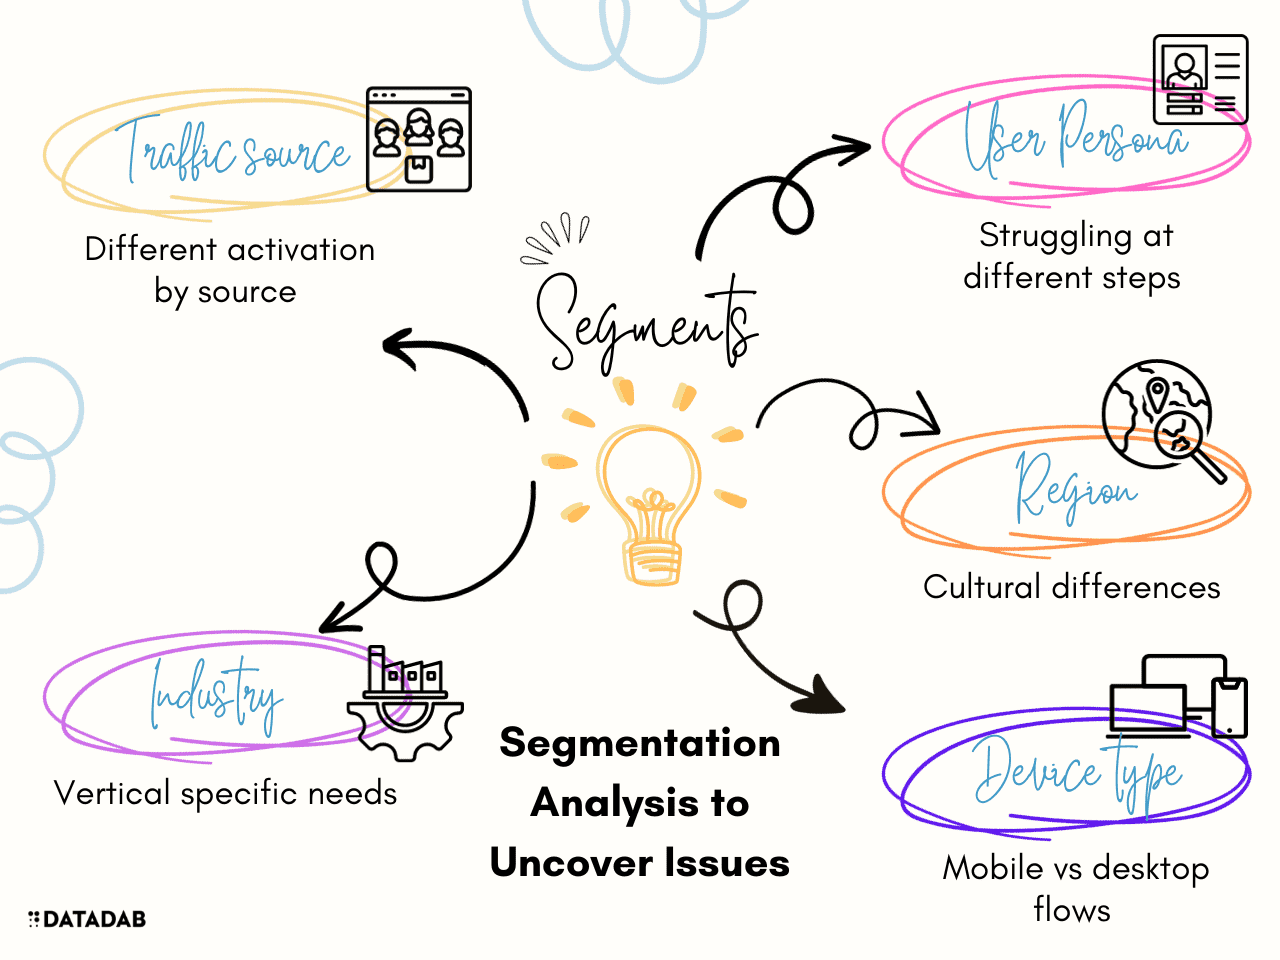
I recommend analyzing conversion rates segmented by:
- Traffic source - Do visitors from different channels have different activation/conversion rates? Prioritize optimizing flows for your best sources.
- User persona - Are certain customer segments struggling more at certain steps? Tailor onboarding for each core persona.
- Geographic region - Are there regional differences in funnel performance? Cultural nuances may require localization.
By slicing your data, you can identify underperforming segments and focus optimization efforts.
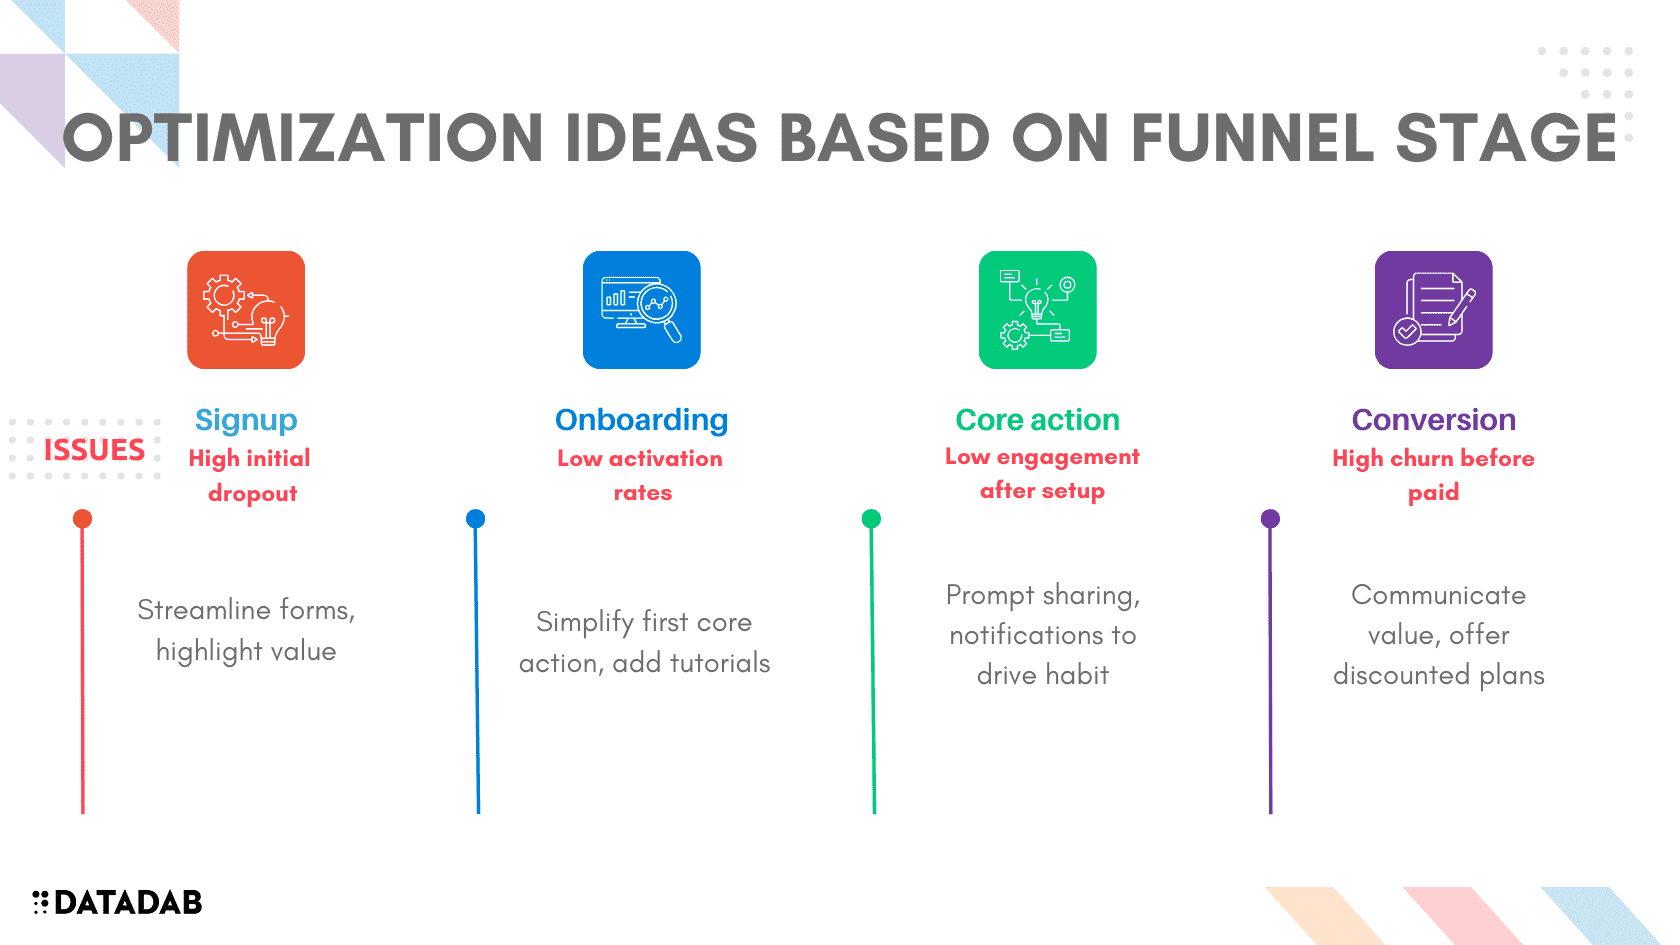
A/B Testing Onboarding
Analytics reveal design flaws but don't tell you exactly how to fix them. This is where A/B testing comes in.
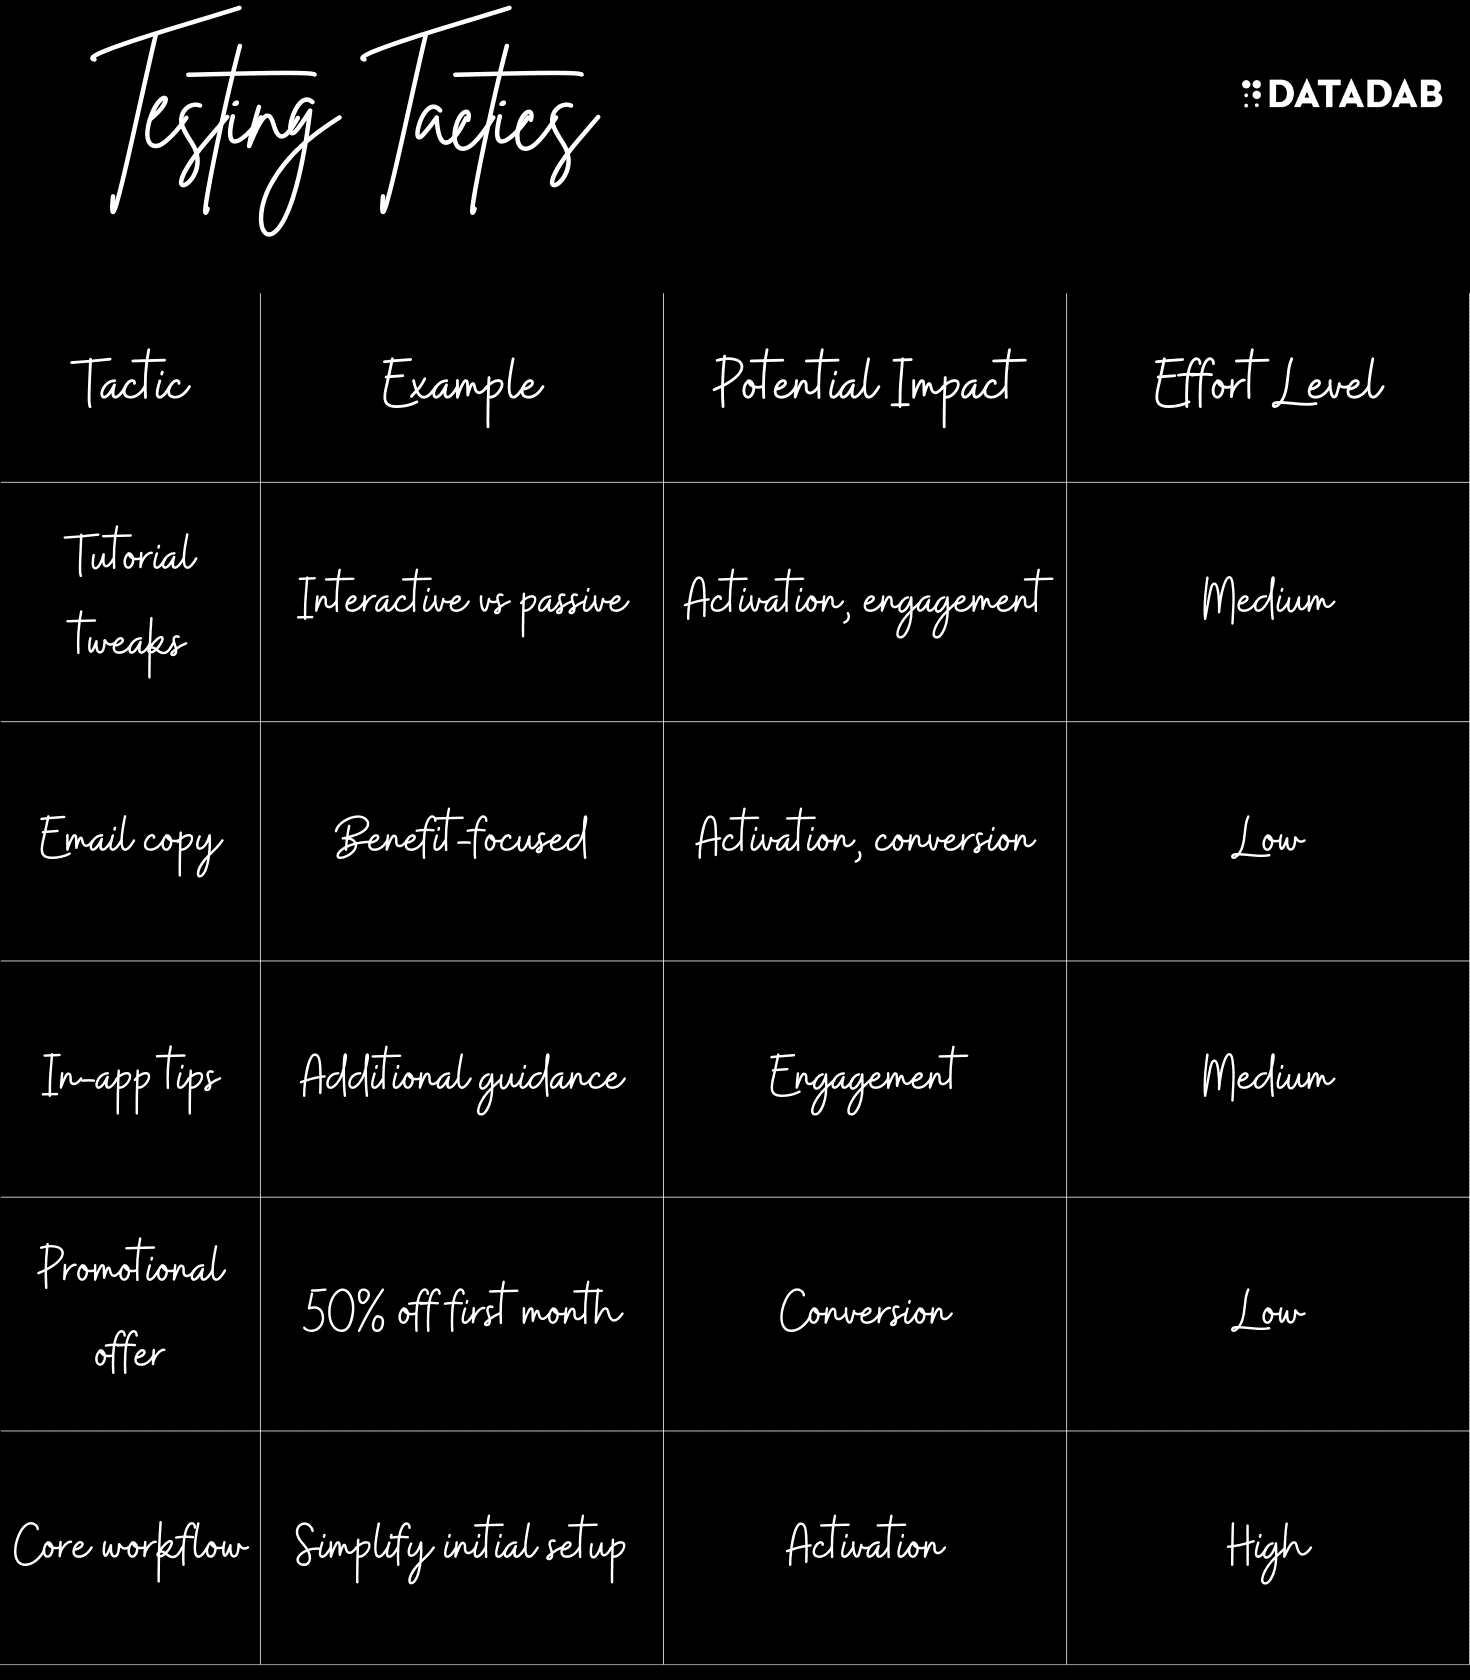
A/B testing allows you to trial versions of your onboarding flows to see which works best. Here are some elements you can test:
Tutorials
- Interactive walkthrough vs static tutorial
- Tutorial before first core action vs after
- Long form vs short form
In-app tips
- Tips on first use vs after N days
- Interactive tips vs passive
- Highlighting new features vs not
Email cadence
- Send educational emails day 1/3/7 or 3/7/14
- Tutorial recap vs motivational content
- Text only vs videos/GIFs
In-product prompts
- Prompt to invite team after 24 hours vs 7 days
- Modal prompt vs passive text
- Proactive chatbot outreach vs no chat
The key is to form hypothesis about where users may be struggling, then test solutions.
For example, you may hypothesize that users don't know how to get started after signup. You test placing a self-guided tutorial front and center on their dashboard instead of passive text tips.
For each test, you want to track the impact on target metrics:
- Activation rate
- Engagement over trial period
- Conversion rate
Over time, you can build an increasingly optimized onboarding experience based on lessons from successive A/B tests.
A/B Test Plan Template
Carefully planning your A/B tests is crucial for generating actionable insights. Use this template to design robust experiments.
Goal Statement
- What part of the user journey will this test optimize?
- What is the specific user pain point being addressed?
- How will this impact activation, engagement, and conversion?
Hypotheses
- Formulate 2-3 specific falsifiable hypotheses
- Quantitatively predict how variants will outperform the baseline
- Justify hypotheses based on qualitative research
Success Metrics
- Primary metric: Activation rate, conversion rate, etc
- Secondary metrics: Feature usage, engagement over time, NPS, etc
- Define targets for statistical significance and practical lift
Variables
- Isolate specific elements to test like copy, layout, prompts, etc
- Limit to minimal viable variants to answer hypothesis
- Avoid changing too many variables at once
Trial Design
- Early stage: Small-scale MVP tests with qualitative feedback
- Full-scale: Sufficient sample size, duration, and appropriate segments
- Analysis plan: Tests for statistical significance like T-tests
- Guardrails: Criteria for stopping bad performing variants
Qualitative Research
- Surveys and interviews with test users to understand reactions
- Assess subjective metrics like ease of use and satisfaction
Results Analysis
- Evaluate qualitative and quantitative data holistically
- Check for confounding factors that could skew results
- Collaborate across teams to interpret findings
Recommendations
- Declare winning variant or no significant difference
- Propose implementation plan and timeline
- Outline future optimization opportunities
Continual Optimization
Optimizing free trials is not a one-and-done process. You need to continually monitor performance and test new ideas.
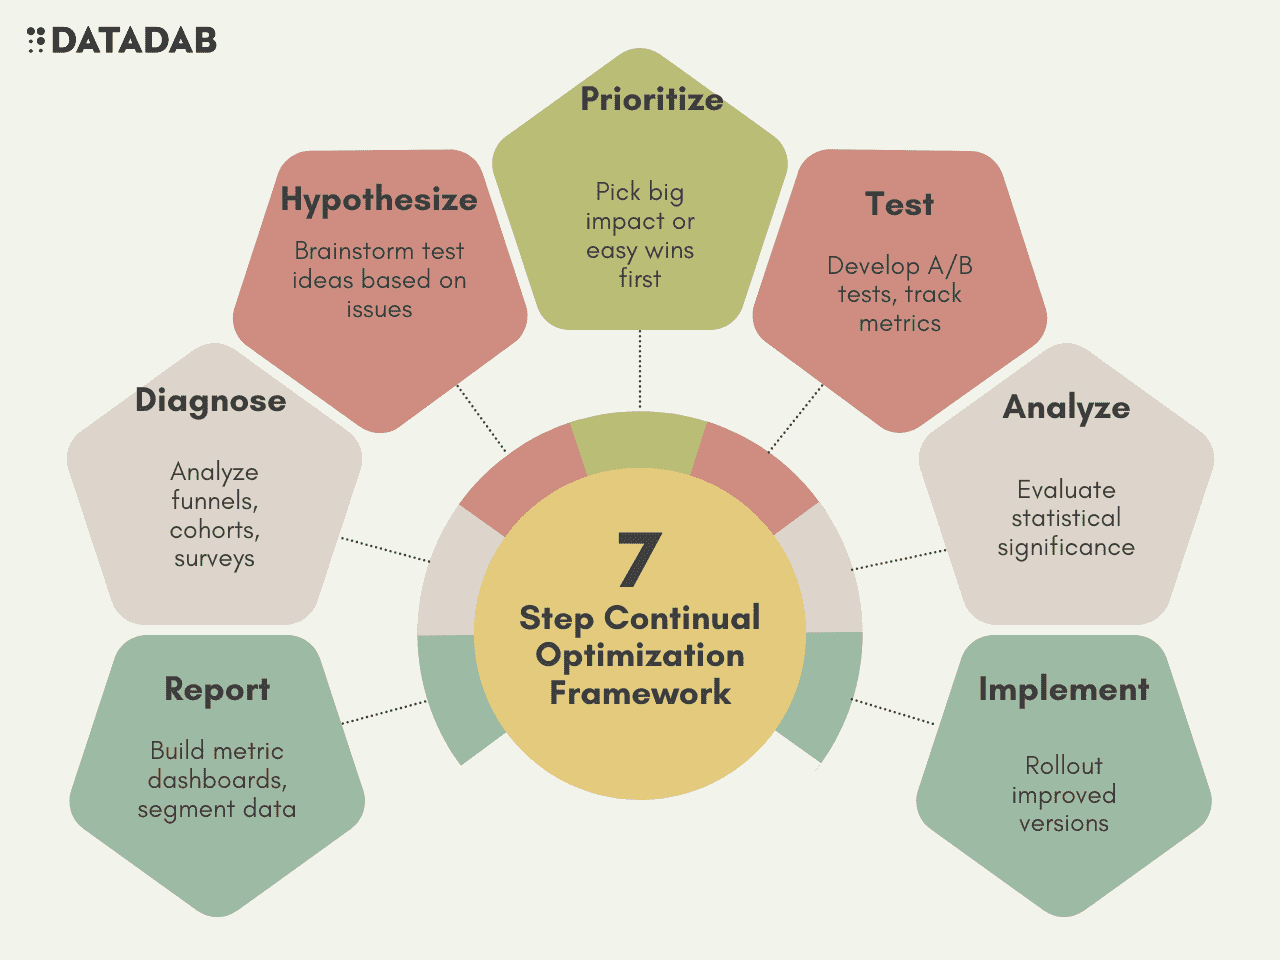
Here is a framework for ongoing optimization:
1. Report on key metrics
Setup dashboards to monitor activation, engagement, and conversion rates weekly or monthly. Segment by traffic source, persona, and region.
2. Diagnose issues
Analyze funnels and cohort engagement graphs to identify leaks or drops. Dig into help tickets and NPS surveys as well.
3. Form hypotheses
Brainstorm solutions to address issues uncovered in analysis. Come up with falsifiable hypotheses to test.
4. Prioritize experiments
Pick hypothesis with biggest potential impact or easiest to test first. Focus on your biggest user segments and acquisition channels.
5. Run A/B tests
Develop trial designs and onboarding variants. Test them against baselines tracking key metrics.
6. Analyze results
Evaluate if new versions produced significant improvements in activation, engagement, and/or conversion.
7. Implement winners
Rollout new onboarding flows that show positive results. Rinse and repeat process.
By continually optimizing, you can increase free trial conversion rates over time. Analytics empower you to make data-driven decisions instead of guesses.
Small tweaks can have big impact. For example, moving one onboarding step earlier increased conversion rates by 20% for one SaaS company. The optimization process never ends!
Key Takeaways
Here are the core lessons on using analytics to optimize SaaS free trials:
- Track activation and engagement rates throughout the free trial period. Monitor by traffic source and persona.
- Analyze conversion funnels from signup to paid conversion. Identify high drop off points.
- A/B test different onboarding flows like tutorials and in-app tips. Test with target metrics.
- Continuously report on metrics, diagnose issues, form hypotheses, test, and optimize.
Leveraging analytics allows you to create data-informed user onboarding experiences. By testing changes, you can increase activation, engagement, and conversion over time.
Optimized free trials increase customer acquisition while reducing churn. Product analytics empower teams to make smart decisions using real user data. Trial and error is the proven path to funnel optimization.
FAQ
Why are free trials so important for SaaS companies?
Free trials are critical for SaaS companies because they allow potential customers to experience using your product firsthand. This helps prospects evaluate if your solution is right for their needs before committing to a purchase. High quality free trials can convert leads into paying users and also provide insights into how customers actually use your product.
Some key benefits of free trials include:
- Reduces barriers to purchase - Customers are more willing to buy after seeing value from a hands-on free trial.
- Drives viral growth - Satisfied trial users help spread awareness if they invite teammates.
- Fuels product development - Watching how trial users interact with your app informs your roadmap.
- Improves conversions - Users that try your product are more likely to purchase compared to cold leads.
What are some key metrics to track for free trial optimization?
Some important metrics to track for free trial analysis include:
- Activation rate - Percentage of signups who get set up with your initial product experience
- Conversion rate - Percentage of signups who convert to paid accounts
- Engagement - Frequency and depth of usage during the trial period
- Feature adoption - Percentage who use key features that drive value
- Drop off rates - Percentage of users who abandon at each step of signup funnel
Monitoring these metrics can reveal how well your free trial is converting visitors and where there are opportunities to optimize.
How can you analyze the conversion funnel to improve free trials?
Analyzing the conversion funnel from visitor to paying customer is crucial to optimizing free trials. Here are some tips on using funnel analysis:
- Map out each step of the funnel from initial signup to payment
- Pull conversion rates at each stage to calculate drop off
- Pay attention to big dropoffs which may indicate issues
- Compare funnel performance for different personas and traffic sources
- Prioritize fixing leaks higher in funnel where more users are impacted
- Test changes and measure impact on funnel metrics
This funnel methodology helps you identify specific areas you can improve to increase overall conversion.
What are some onboarding elements you can A/B test?
Some elements of onboarding you can A/B test include:
- Tutorials - Test interactive vs static formats, length, placement
- In-app messaging - Test tips for engaging users after setup
- Emails - Test cadence, content, videos vs text
- Prompts - Test modals vs passive text, timing, and placement
- Page flows - Test simplifying or shortening initial workflows
You want to test changes that target where users appear to be struggling based on analytics. Prioritize testing further up the funnel first.
How can you generate hypothesis for A/B testing onboarding?
Here are some strategies for forming hypothesis to test onboarding improvements:
- Review analytics funnel and engagement data to pinpoint problem areas
- Look at in-app behavior recordings to see where users struggle
- Read support tickets and chat transcripts to identify recurring issues
- Survey users who don't convert and those who do on experience
- Check if high performers have different behaviors than those who churn
- Research proven best practices outside your company for ideas
Develop specific, testable hypotheses about how you can improve poor performing areas.
What are some metrics to measure the impact of A/B tests?
When running onboarding A/B tests, you want to track metrics like:
- Activation rate
- Engagement over trial period
- Conversion percentage
- Time to initial core action
- Feature adoption
- Churn or downgrades after trial
Look for statistically significant differences between the variant and baseline for these metrics. Avoid optimizations that only impact vanity metrics like clicks but not business results.
How can you prioritize what to test when optimizing trials?
Some ways to prioritize what to test first when optimizing trials include:
- Identify the largest leak in the funnel and start there
- Test easier changes like copy before larger UX changes
- Target stages with the biggest dropoff rates first
- Focus on your highest value acquisition channels and segments
- Start with parts of the funnel that impact all users first
In general, go after quick wins that can boost conversion rates before testing riskier changes. Use analytics to size opportunities.
What are some tips for continually optimizing free trials over time?
Here are some tips for continually optimizing free trials:
- Don't treat it as one-and-done - monitor metrics and run tests regularly
- Build processes for ongoing experimentation into team workflows
- Review analytics frequently to spot new issues emerging
- Log results from past tests to avoid repeating failed tests
- Talk to customers for qualitative insights to complement data
- Develop a roadmap of prioritized hypothesis and focus areas
- Celebrate wins and learnings to build team excitement
Optimization is an iterative process. Take advantage of what you learned from the last test to improve the next one.
How can you drive adoption of analytics best practices internally?
To drive adoption of analytics best practices for free trial optimization internally:
- Educate teams on the business value of experimentation and testing
- Show examples of optimizations driven by analytics that increased conversion
- Incorporate review of key metrics and funnel analysis into standard workflows
- Set goals around A/B testing onboarding flows and celebrate wins
- Build self-serve analytics dashboards so anyone can access data easily
- Offer trainings and office hours to demystify analytics and testing
- Highlight teams and individuals who demonstrate analytics excellence
Proactively invest in growing your company's data-driven culture.
What are some common mistakes companies make when trying to improve free trials?
Some common mistakes include:
- Changing too many variables at once so impact is unclear
- Running low-powered tests that can't achieve statistical significance
- Failing to instrument analytics properly to capture user behaviors
- Testing and optimizing without tying changes to clear goals
- Making subjective opinions rather than data-driven decisions
- Not tracking long enough to measure true impact on conversion
- Prioritizing vanity metrics like clicks instead of business results
- Ending tests and reverting changes too quickly after launch
Avoid these pitfalls by taking an iterative, metrics-focused approach to continuous optimization.