
There’s a notion that if you build a great product, users will naturally come flocking. They'll spread the word. They’ll become loyal advocates. Growth will be exponential. But as romantic as that might sound, the reality is often murkier. Growth doesn’t flow like a river, unimpeded and clear. Instead, it’s often blocked by rocks—some small, some massive. These rocks create friction, and when you’re trying to drive growth in a product-led framework, friction is your worst enemy.
That’s where friction logging comes in. Think of it as an investigative journalist’s approach to growth problems. You’re not just taking a surface-level glance at what’s happening. You’re getting deep, conducting interviews with data, examining every crevice for clues, and ultimately aiming to uncover every bump, hesitation, and frustration that stops your users from converting or sticking around.
If you’re in the thick of growing a PLG product, you’ve probably had moments where you knew something was off, but you couldn’t quite put your finger on it. Friction logging aims to be your flashlight in the darkness—illuminating those bottlenecks that are often hidden under layers of assumptions, product complexity, or simply a lack of empathy with the user's experience.
Let’s break down friction logging and discuss how you can apply it to systematically eliminate PLG bottlenecks.
Friction in a PLG Model
Friction in a PLG environment is anything that hinders a user's journey to value. It’s that one extra click that makes someone drop off. It’s a confusing onboarding message. It’s a feature that’s powerful but buried so deeply within the interface that no one can find it.
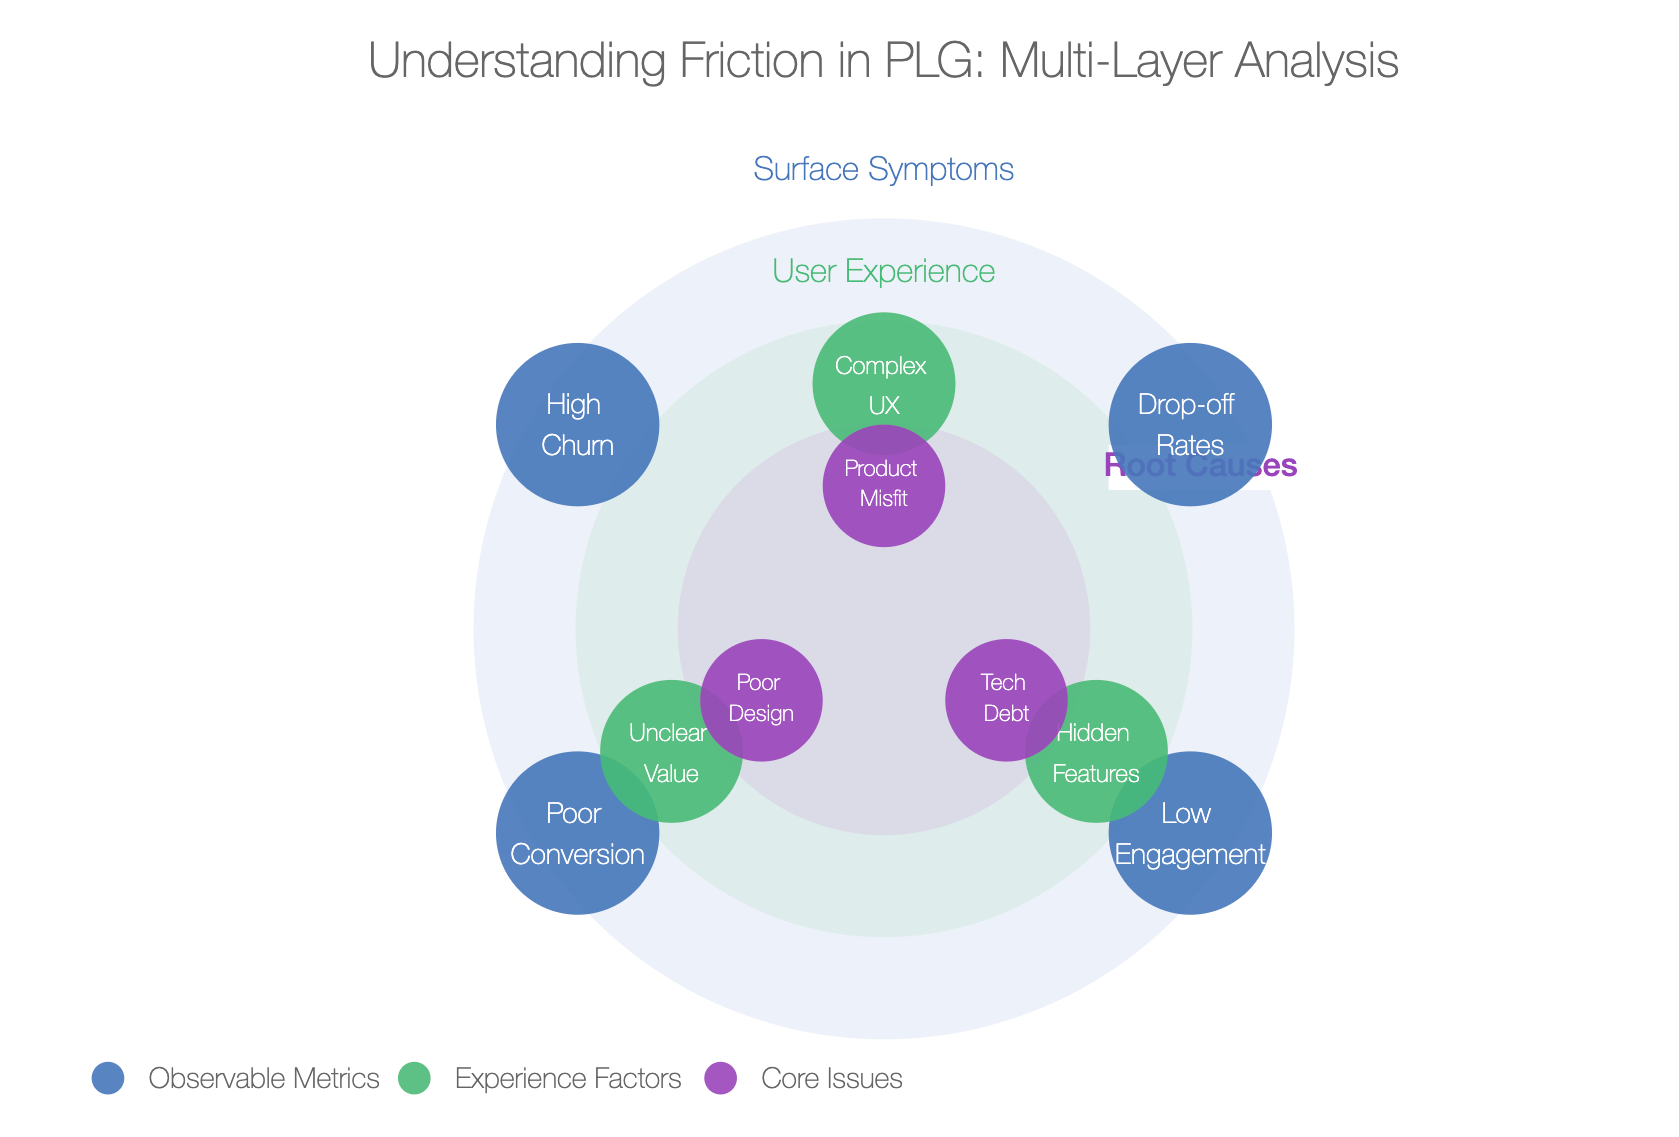
Unlike traditional sales-led or marketing-led models, PLG relies entirely on the product to drive growth. Your product is your salesperson, your marketer, and your conversion funnel all wrapped into one. If that product—or, more precisely, the experience of interacting with that product—isn’t smooth, growth stalls.
But friction isn’t always apparent. In fact, sometimes friction looks like “success” on the surface. Users might be signing up in droves, but then you see them ghosting you before they’ve used your core feature even once. Your signups have an uptick, but your active users remain stagnant. Something’s broken, but it’s not clear where. This is the friction you need to log and eliminate.
Friction is not the user's fault. Often, it's a communication gap between what your users expect and what your product delivers. The secret sauce of growth lies in understanding this disconnect and systematically closing the gap. With friction logging, the mission is to dissect user paths with clinical precision—find the bumps, identify the drops, and methodically turn those into accelerators for growth.
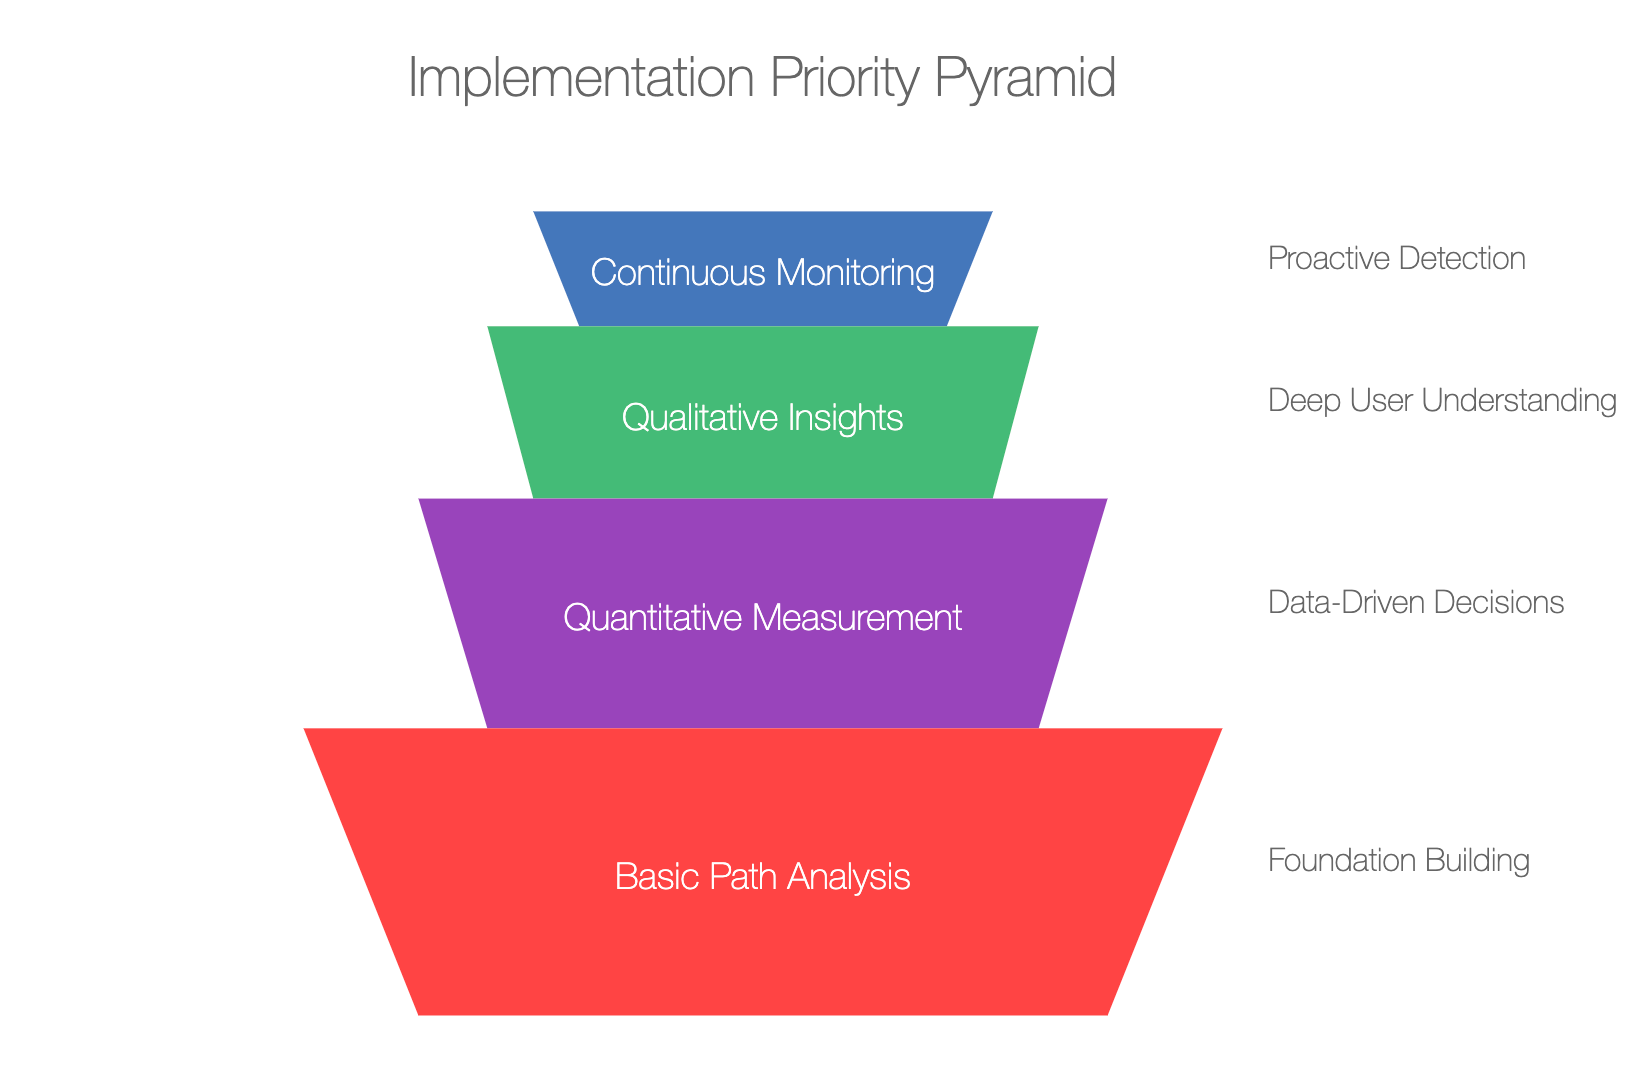
The Friction Logging Methodology
Friction logging is a structured, step-by-step way to understand how users experience friction within your product. Here’s how you can make it work for your PLG strategy.
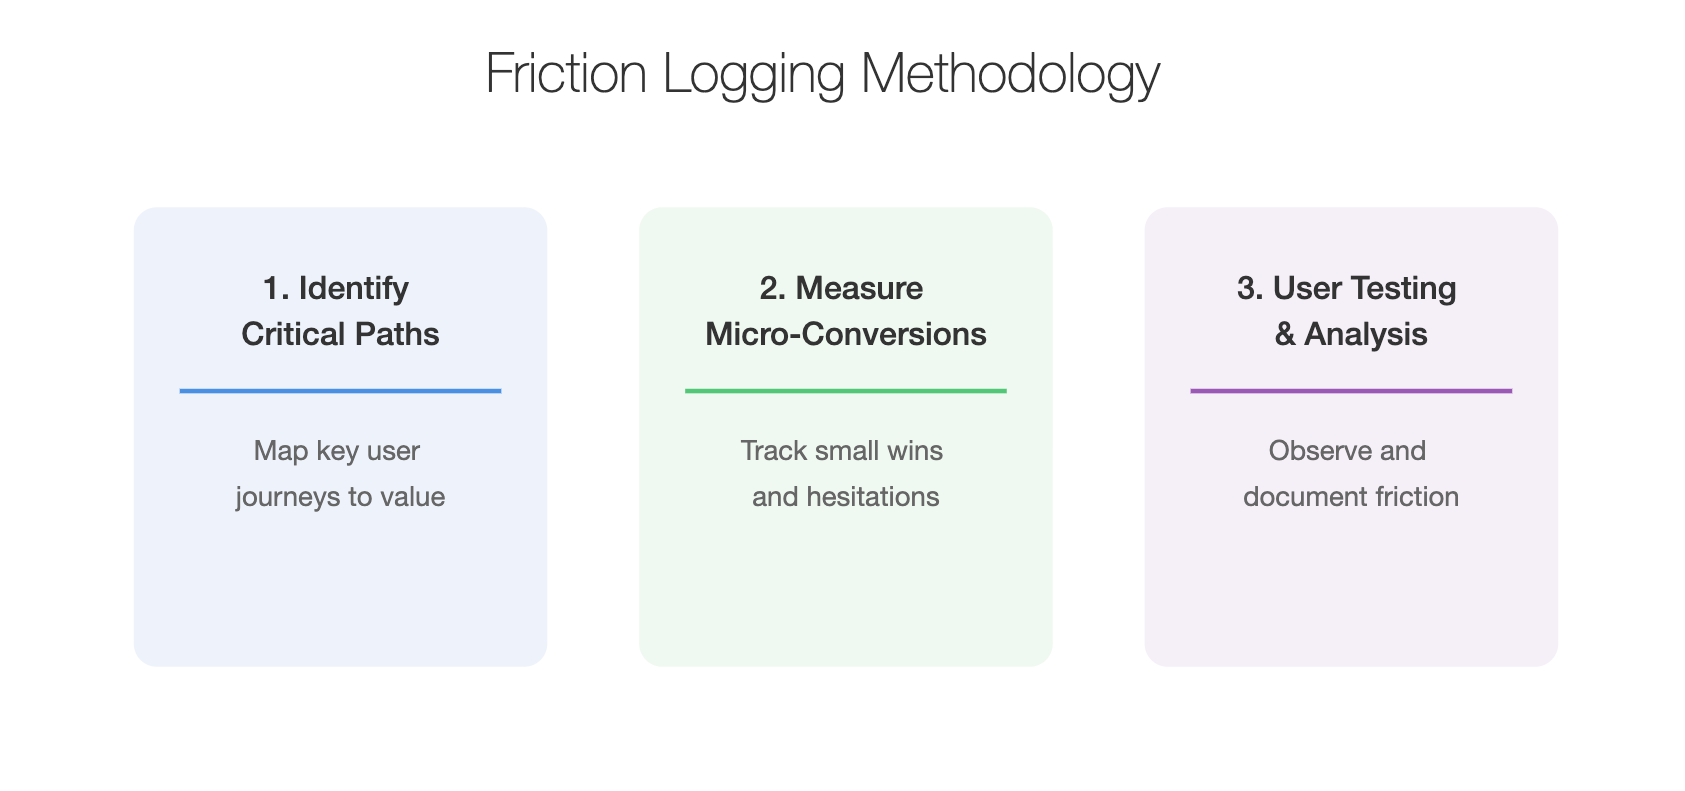
1. Identify Critical User Paths
The first step in friction logging is knowing where to look. Start by mapping out your most crucial user paths—these are the sequences of actions that, when completed, lead users to value.
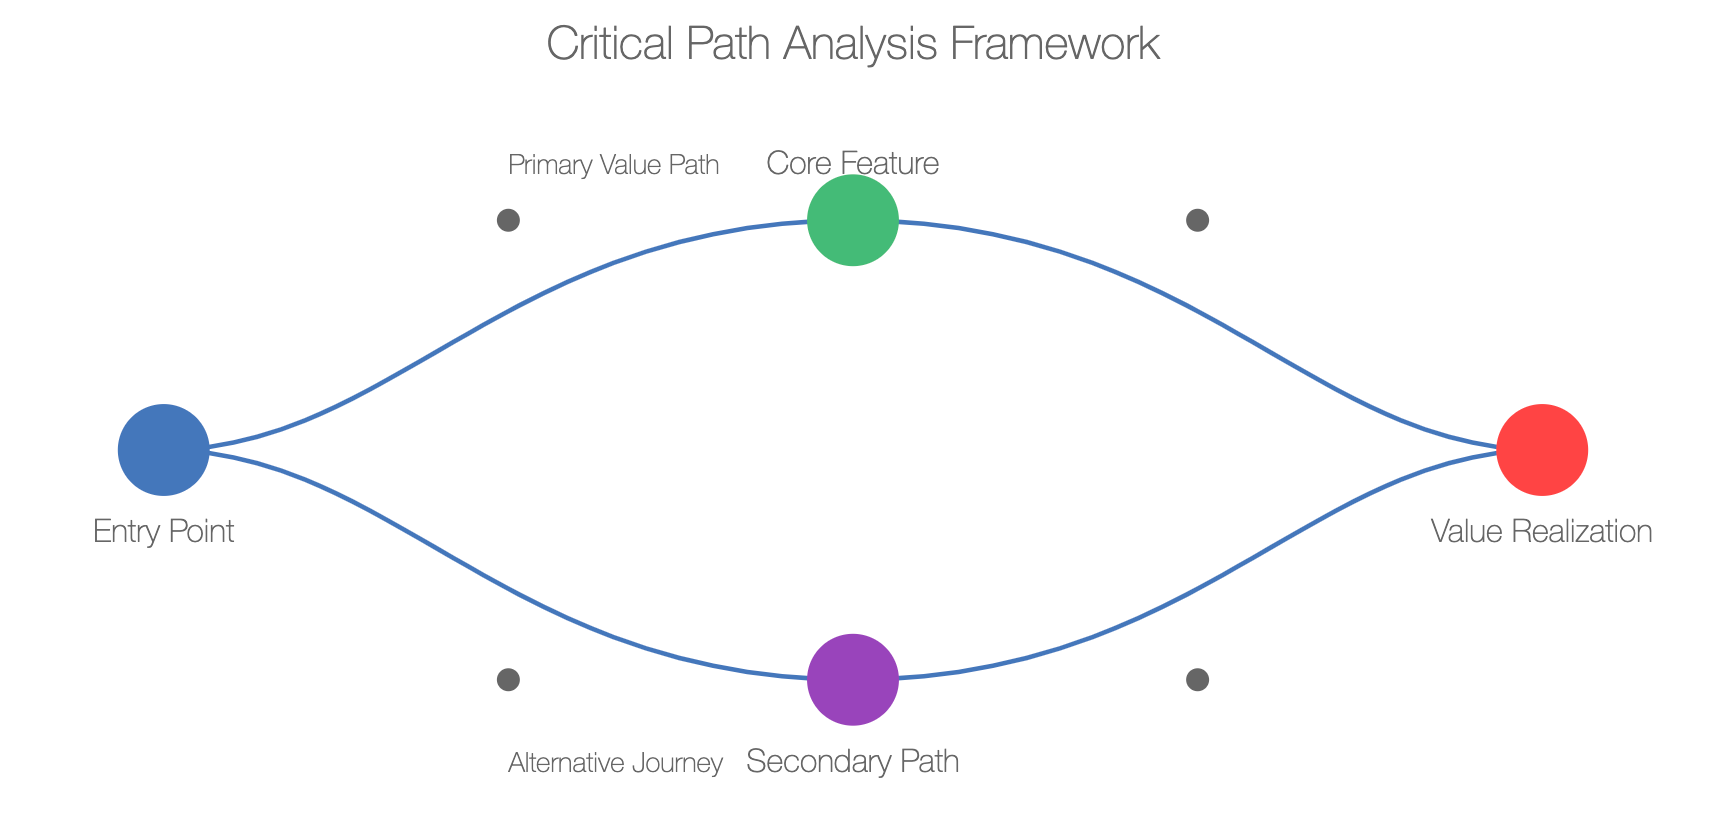
For a product like Slack, this critical path might be a new user joining a workspace, sending a message, and setting up a channel. For a product like Miro, it could be a user creating their first board and collaborating with another person.
Here, it’s essential to hone in on the “moments of value.” These moments are the “aha” instances when a user understands how your product makes their life easier or better. Your task is to identify the paths that lead directly to these moments and scrutinize them for friction.
Pro Tip: Don’t guess where these moments of value are—validate them with data. Heatmaps, journey recordings, or simple user feedback can be instrumental in figuring out which interactions drive users to come back.
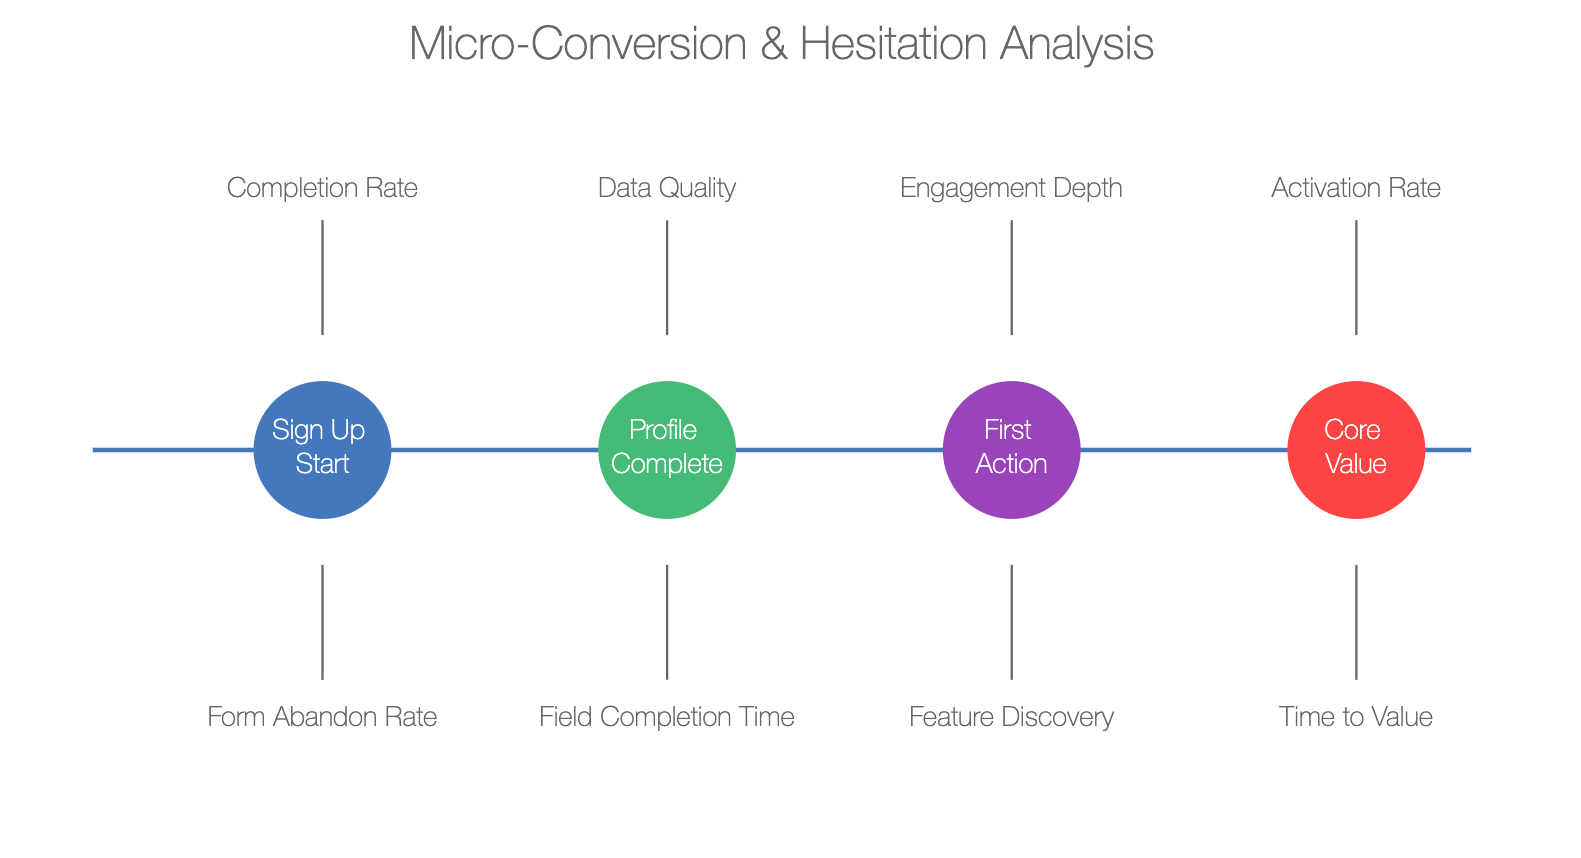
2. Measure Micro-Conversions and Hesitations
The beauty of PLG lies in being user-centric, and understanding micro-conversions is a key part of this process. Micro-conversions are those small victories along the way—clicking on a button, inviting a friend, or engaging with a feature.
| Micro-Conversion | Potential Friction | Insights to Address |
|---|---|---|
| Click on CTA Button | Hesitation due to unclear value | Improve CTA copy clarity |
| Filling a Form Field | Hesitation on mandatory fields | Remove unnecessary fields |
| Feature Interaction | Low engagement with feature | Enhance discoverability |
To effectively log friction, measure not only the major milestones but also the micro-conversions within those user paths. For instance, if you have a signup flow, are users hesitating at a particular field? If you offer a free trial, what’s the adoption rate of the key feature during the trial period? These hesitations are the nuggets of insight you need to address.
A common hesitation point in many products lies in asking for too much information too soon. For instance, requiring credit card information during a free trial sign-up can cause massive drop-offs—this is a high-friction point. Logging these friction points is all about paying close attention to these subtle moments of hesitation and identifying what’s driving them.
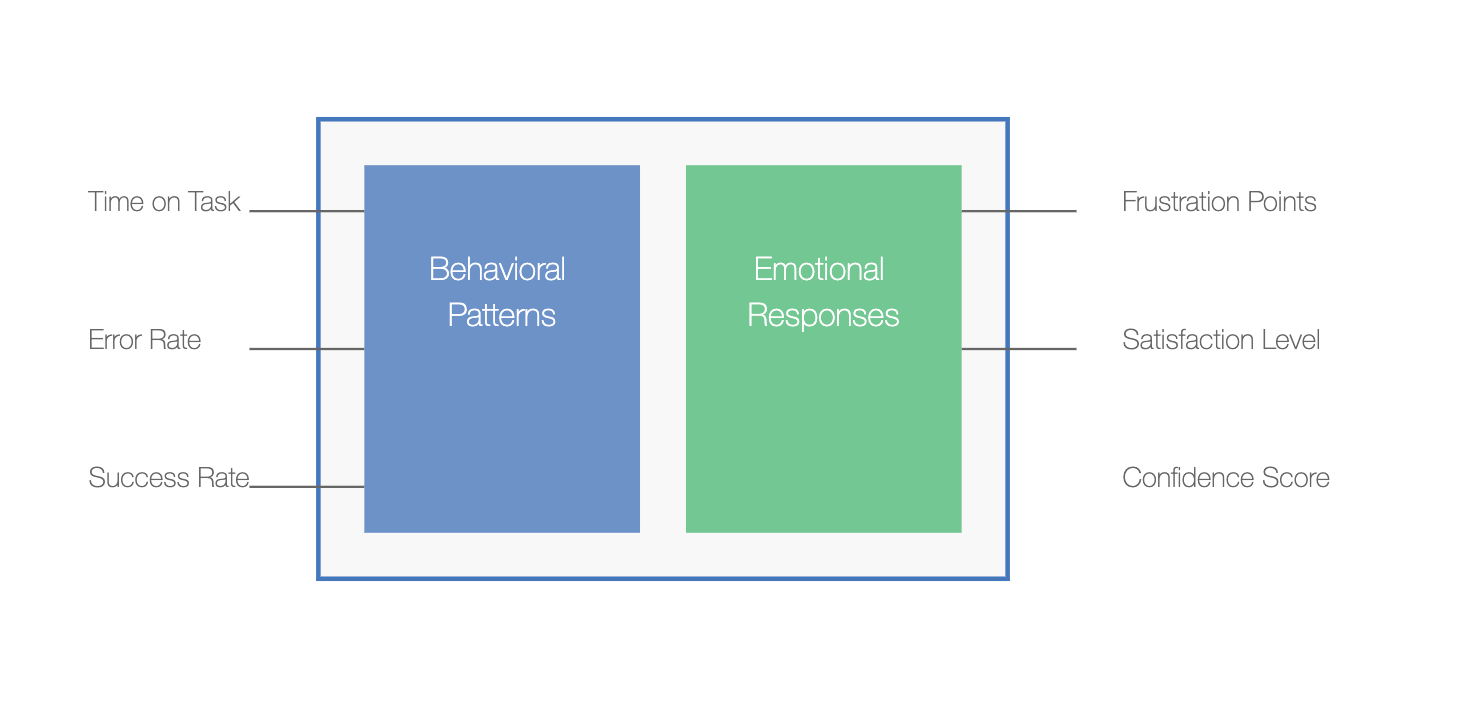
3. User Testing and Observational Analysis
The next step is all about empathy—get in the user's shoes. Conduct user testing that’s as unbiased as possible. You don’t want to guide the user too much or make them feel self-conscious about making mistakes. You want to watch where they stumble naturally.
There’s a famous UX principle: “Users are not always going to use your product the way you expect.” A founder or designer might think that a feature is intuitive, but for a new user, it can feel like solving a Rubik's cube without any instructions.
Key Insight: Users often get frustrated before they reach out for help. Observational user testing can help you catch these moments of frustration before they turn into lost opportunities.
You can do this through recorded sessions using tools like Hotjar or FullStory, or by physically sitting with users and asking them to perform specific tasks while you take notes. Notice the pauses, the confused clicks, and the sudden changes in course. Every one of those moments is a piece of friction that’s holding your growth back.
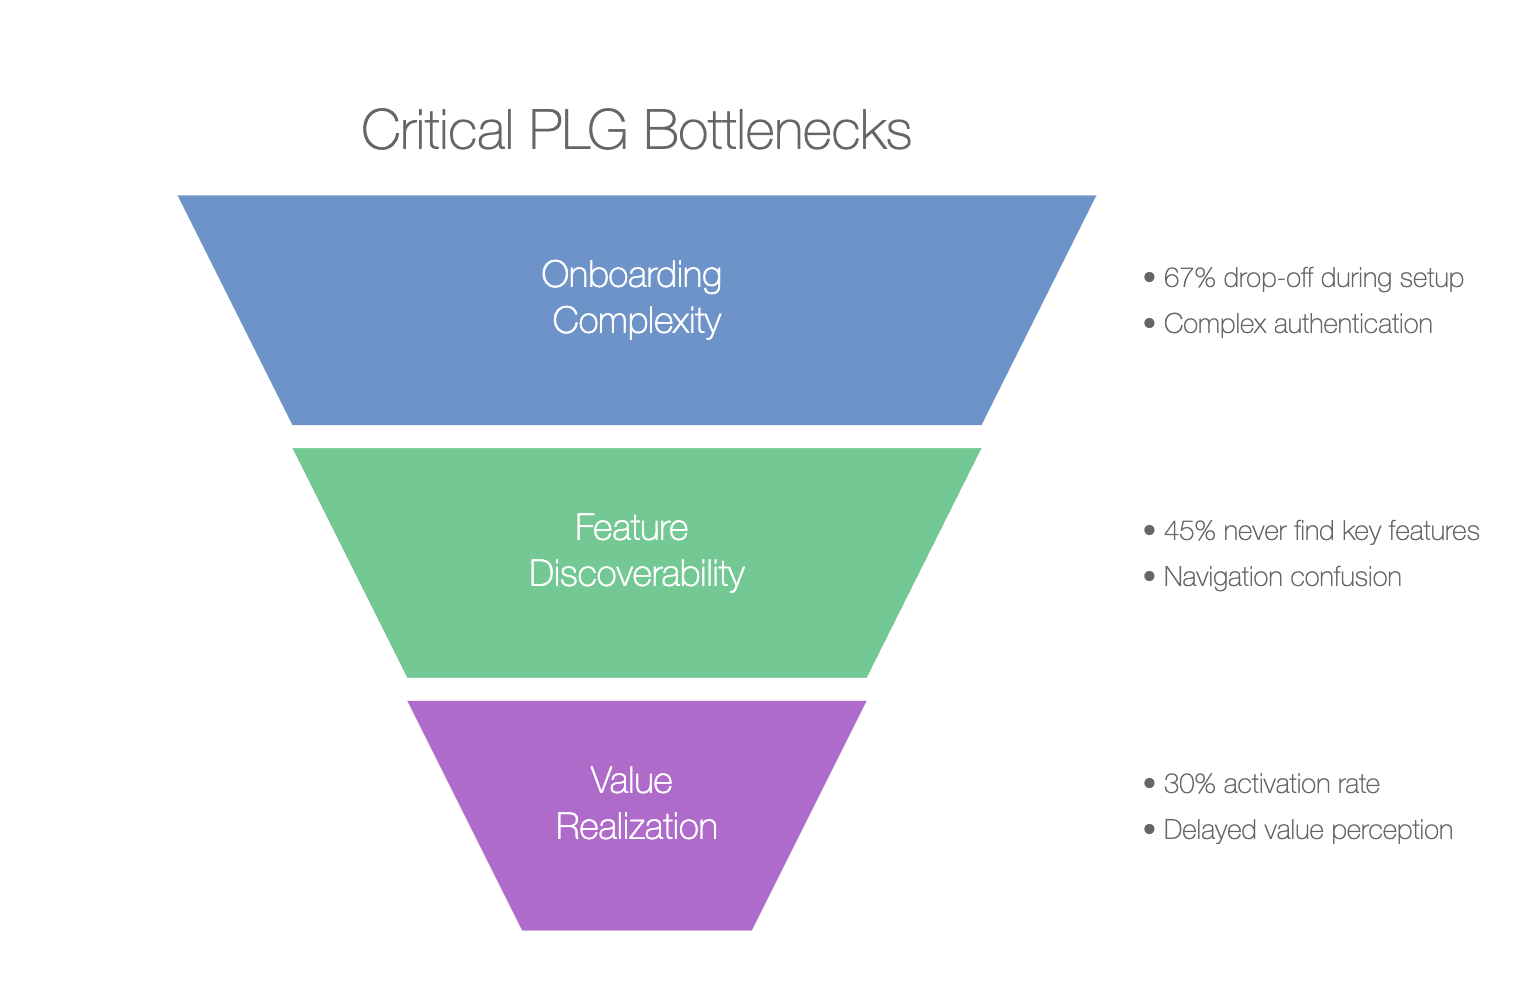
Common Bottlenecks in PLG and How to Log Them
Based on my experience at DataDab working with a range of PLG products, certain friction points tend to be universal. Here’s how to systematically address a few common ones.
| Onboarding Step | Drop-off Rate (%) | Potential Cause | Suggested Fix |
|---|---|---|---|
| Sign-Up Form | 25% | Too many fields | Simplify the form |
| First Interaction | 30% | Lack of feature guidance | Introduce guided walkthrough |
| Account Verification | 15% | Users unaware of next step | Improve communication clarity |
1. Onboarding Bottlenecks
Onboarding can make or break your product-led growth. If your onboarding process is convoluted, users will bounce. It’s that simple. Friction logging during onboarding can include mapping out exactly where users lose interest.
For instance:
- Drop-offs at Sign-Up: Are users dropping off at a particular question during sign-up? Why is that?
- Failure to Complete Onboarding: What percentage of users who start the onboarding flow complete it? If it’s less than 70%, you have friction to investigate.
If you notice drop-offs at a specific onboarding step, use a combination of qualitative and quantitative analysis. Survey users to understand their objections and look at the data to see if there’s a pattern among those who drop off.
One best practice I’ve found effective is to add value-driven friction. If you must add friction, make sure the user knows why—for instance, giving context about why you’re asking for specific information.
2. Feature Discovery
One core tenet of PLG is that users drive growth by discovering the value themselves. However, if critical features go unnoticed, your users won't be able to truly understand the product's worth.
Log friction around feature discovery:
- Which key features are users not interacting with?
- Are users getting stuck because they aren’t finding these features organically?
For example: If your product has a killer collaborative feature, but only 10% of users are using it, it’s a signal that there’s friction preventing its discovery. In my experience, highlighting features in onboarding or utilizing progressive disclosure techniques can lead to meaningful improvements.
3. The Churn Bottleneck
Churn is the ultimate sign of friction that has gone unnoticed for too long. Friction logging needs to extend to your churned users—this is where a lot of growth potential lies hidden.
To effectively friction-log for churn, create segments of users based on when and why they left. Look for common patterns. Did a large percentage of users leave after a specific new feature release? Did users churn because the value wasn’t apparent in a particular month?
Sometimes, the reasons are incredibly simple. For instance, users might be churning because the onboarding didn’t help them discover the core value. Sometimes, users leave because there’s one critical bug that’s driving them mad. Logging these friction points—systematically and honestly—can be the best way to plug your leaks and maintain consistent growth.
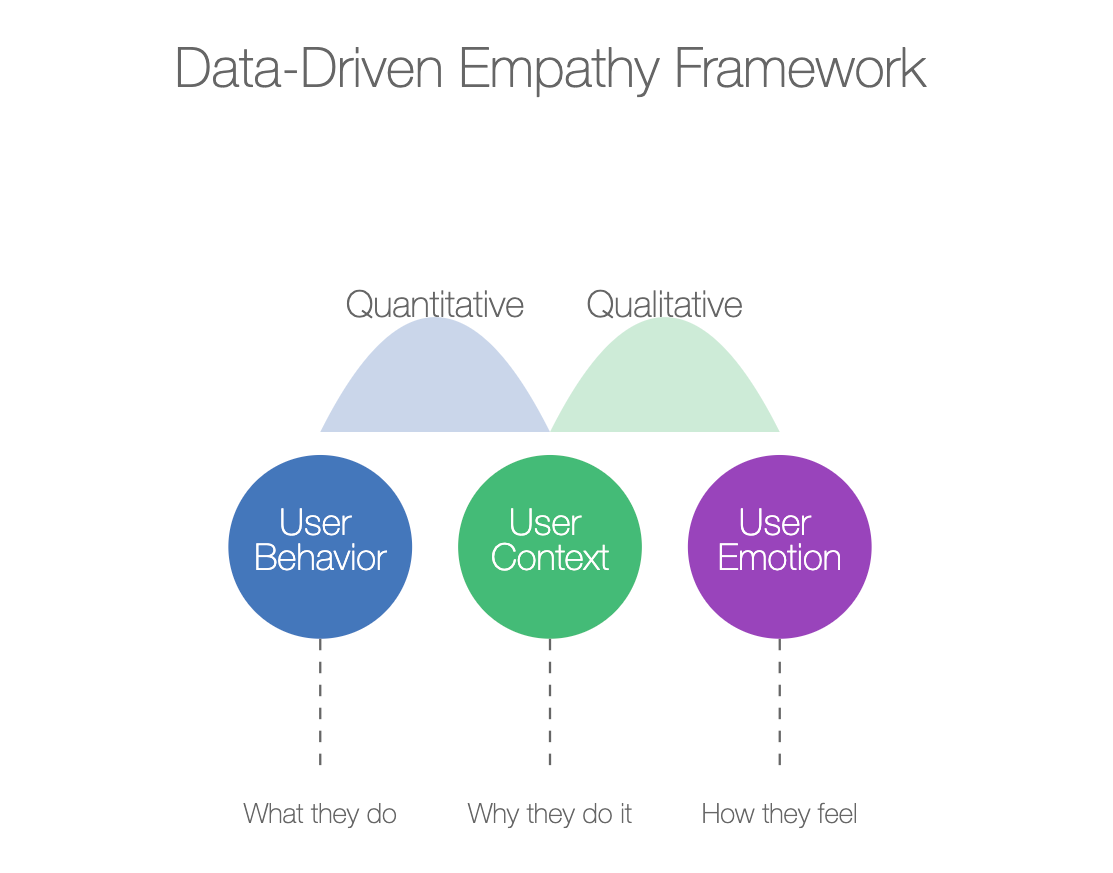
How Data-Driven Empathy Fuels Effective Friction Logging
The goal of friction logging isn’t just eliminating the bumps; it’s about building an empathetic understanding of your user’s journey. Data can be immensely powerful here, but raw data alone rarely tells the full story. Combining data with qualitative research—like interviews, usability testing, or watching session recordings—is what gives you the insight you need to drive change.
There’s a term I like to use at DataDab: data-driven empathy. When you’re working on a PLG product, the users aren’t just numbers on a screen—they are people trying to solve problems, save time, or get value from your product. Friction logging is effective only if it’s accompanied by a mindset shift toward truly empathizing with what these people are trying to achieve.
Empathy + Data Example: If your analytics show that a large percentage of users drop off during onboarding, it’s not just about adjusting the UI or changing a button color. The question to ask is “why?” Why are users hesitating? Are you asking for too much, too soon? Did they not understand the product’s value yet? Surveys, user interviews, and simple feedback prompts can unearth the reasons behind the data.
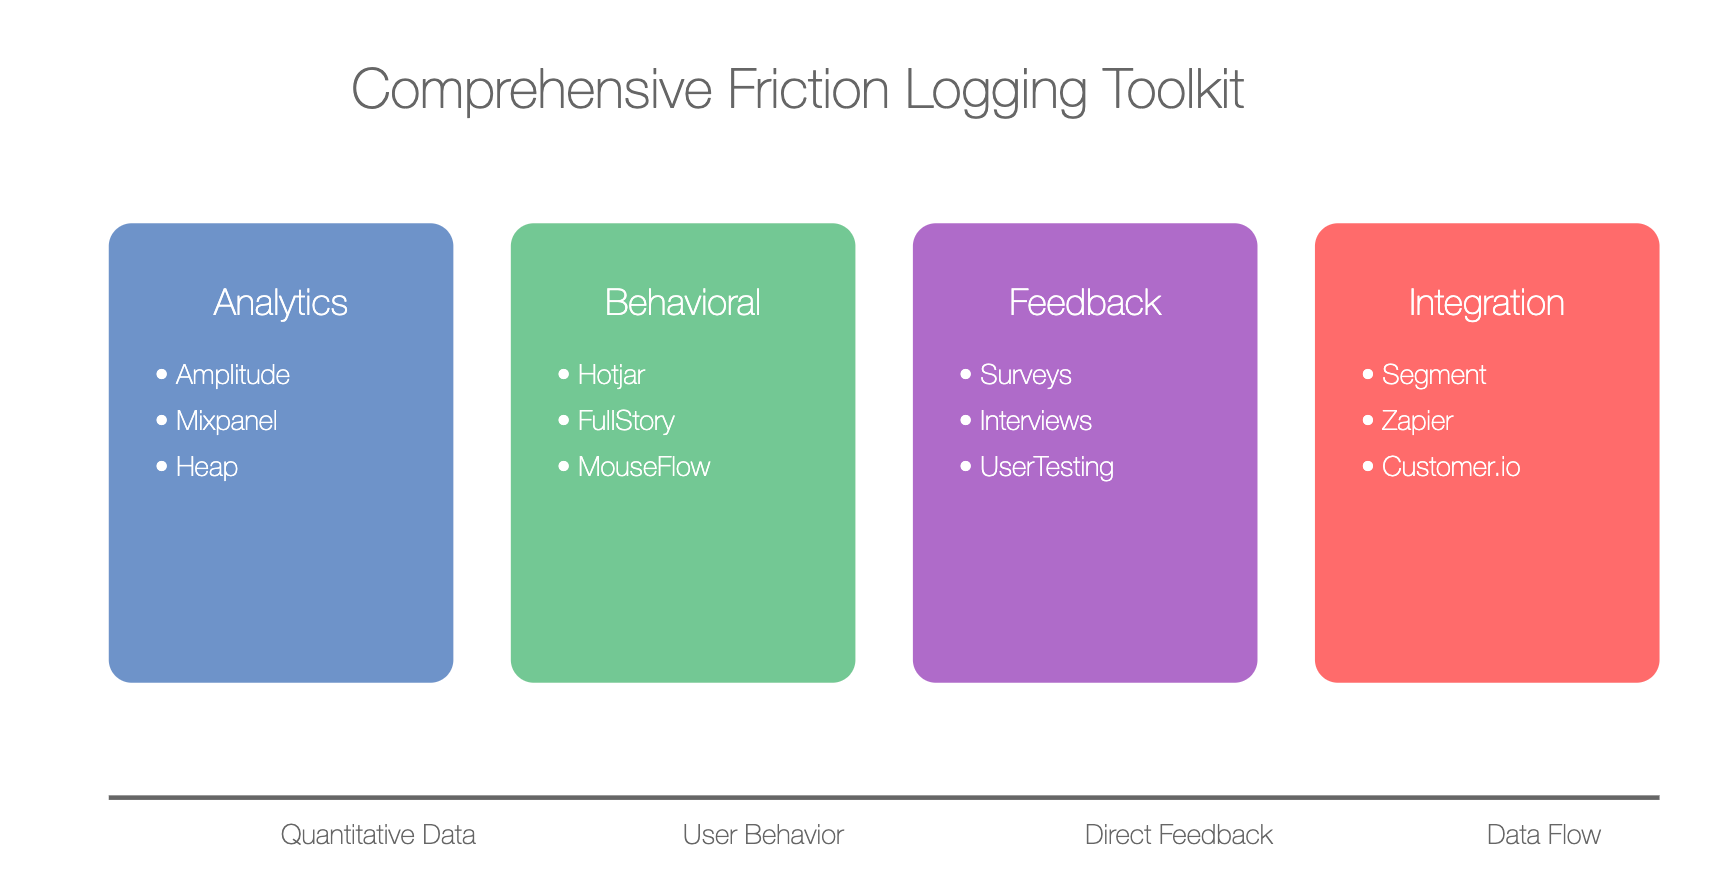
Tools for Effective Friction Logging
There’s no shortage of tools that can help you log friction. Here are some specific recommendations and how to use them effectively:
| Tool | Use Case |
|---|---|
| Hotjar | Heatmaps & session recordings |
| FullStory | Deep dive into user sessions |
| Heap | Automate journey tracking |
| Amplitude | Measure and compare user paths |
| Mixpanel | Track funnel progress & drop-offs |
- Heatmaps can give you insight into which parts of a page users are engaging with, and where they’re hesitating.
- Session recordings can help you understand user behavior and map out paths that lead to frustration.
- Surveys and feedback forms are the key to qualitative understanding—sometimes, simply asking “Was this helpful?” is enough to provide clarity.
Combining multiple tools can often lead to deeper insights. For example, if you see drop-offs in Mixpanel, go back and watch sessions in FullStory to figure out why users are dropping off at that step. The layered approach pays off when systematically logging friction points.
Friction is Growth’s Silent Killer
PLG is all about using the product itself as the main driver of user acquisition, conversion, and expansion. But the problem with a “product-driven” approach is that any bumps in the road—even small ones—can create churn, slow adoption, or worse, prevent users from ever reaching value. Friction is the silent killer of PLG growth.
Friction logging can feel a bit like detective work—and it is. The insights you gain will often come from digging deeper than you’re used to, analyzing both quantitative and qualitative data, and putting yourself in your users' shoes. At DataDab, we’ve found that successful friction logging requires curiosity, empathy, and, yes, even a little bit of obsession.
It’s about knowing that every hesitation from a user is a potential lost opportunity. And when you fix those hesitations—when you identify that bump and smooth it out—that’s when the magic of PLG really kicks in.
If you’re ready to dive in, friction logging is your roadmap to a smoother user journey and exponential growth. It’s the behind-the-scenes work that ensures the product you’ve built can finally live up to its full growth potential.
FAQ
1. What is friction logging in the context of PLG?
Friction logging is the process of systematically identifying and analyzing points of friction within a product-led growth (PLG) model. It involves mapping user journeys, analyzing drop-off points, and conducting user testing to pinpoint areas where users experience confusion, hesitation, or frustration. The goal is to eliminate these bottlenecks to create a smoother, more effective user experience.
2. Why is friction considered a major bottleneck in PLG?
In PLG, the product itself is responsible for driving acquisition, conversion, and retention. Any friction in a user’s journey—such as confusing onboarding, hidden features, or clunky UX—can lead to drop-offs, decreased engagement, and churn. Friction slows users down from realizing the product's value, ultimately stalling growth.
3. How can I identify critical user paths for friction logging?
Start by mapping the main paths users take to reach key moments of value—these are actions that lead directly to users understanding and using your product effectively. Validate these paths using data from tools like heatmaps and journey recordings to ensure they are aligned with how users interact with your product.
4. What are micro-conversions, and why are they important in friction logging?
Micro-conversions are small actions that lead users toward larger milestones, such as clicking a CTA, filling out a form, or using a feature. Tracking these actions helps uncover subtle points of hesitation or drop-off that could be preventing users from reaching core value, allowing you to address small frictions that could have a significant impact.
5. What tools are effective for friction logging?
Tools like Hotjar, FullStory, Heap, Amplitude, and Mixpanel are commonly used for friction logging. Hotjar and FullStory provide heatmaps and session recordings for visual insights, while Heap, Amplitude, and Mixpanel help track user journeys, analyze drop-offs, and identify friction points in conversion funnels.
6. How can I reduce onboarding friction in a PLG product?
To reduce onboarding friction, ensure that the sign-up flow is as simple as possible, eliminating unnecessary steps. Add context to any information requested to help users understand its value. Make onboarding interactive with guided tours and ensure users are led smoothly to the product’s core value as quickly as possible.
7. What role does user empathy play in friction logging?
User empathy is crucial for effective friction logging because it helps you see the product from the user's perspective. Combining data-driven insights with empathy allows you to understand not just where users struggle, but also why. This combination of quantitative and qualitative analysis leads to more actionable insights that improve the user experience.
8. How do I analyze friction around feature discovery?
Analyze which features are being underutilized and why users might be missing them. Use session recordings to understand user flows and observe if users struggle to find or use a key feature. Highlight important features during onboarding or implement progressive disclosure to reveal features contextually.
9. What are common signs that friction is causing churn?
Common signs include users dropping off during onboarding, not reaching the "aha" moment of value, or decreased engagement with core features over time. Segment churned users to understand when and why they left, and look for patterns such as specific feature releases or bugs that coincided with increased churn.
10. Can friction logging work for different types of products, or is it mainly for SaaS?
While friction logging is highly effective for PLG and SaaS products due to the self-serve nature of these models, it can also be applied to other digital products and services. The process of mapping user paths, tracking hesitations, and using observational analysis to identify friction points can improve the user experience across various industries, from e-commerce to mobile apps.