Google recently changed the speed report in Google Search Console, which is now called the “Core Web Vitals.” It draws data from Google’s new Web Vitals engine, released on May 5, 2020. The new Core Web Vitals report is similar to the old speed report, but it includes several new key metrics — Largest Contentful Paint (LCP), First Input Delay (FID), and Cumulative Layout Shift (CLS).
Then, in a Google Webmasters Central Blog Post on May 28, 2020, Google announced merging core Web Vitals metrics with their current user experience rating signals.
So I decided to get down to it, make sense of it, and put it all together. I hope this helps our readers understand what’s happening, what’s changed, and how you can plan for this update.
Optimizing user experience is critical to any website’s long-term success. If you’re a business owner, marketer, or developer, Web Vitals will help measure your site’s experience and detect areas for improvement.
Web Vitals is Google’s project to provide precise instructions on signals critical to delivering a better user experience. Over the years, Google has developed tools to quantify and report on web performance. Some developers are skilled at using these tools, while others find all these tools and metrics cumbersome and challenging to keep up with.
Site owners should not have to be performance gurus to understand their users’ quality of experience. The Web Vitals initiative by Google attempts to make this landscape a bit simpler for everyone and help sites focus on the most critical metric, Core Web Vitals(at least in the coming times).
This update is scheduled to come out in 2021, and Google has confirmed there is no need to take immediate action.
To help us prepare for these changes, however, they updated the tools used to measure page speed, including PSI, Google Lighthouse, and Google Search Console Speed Report.
What are Core Web Vitals?
Core Web Vitals are a component of the Web Vitals initiative that applies to all web pages. They must be measured by all webmasters and will be present across all Google tools. Each of the Core Web Vitals reflects a unique aspect of user experience. These aspects are quantifiable and measurable and attempt to reflect real-world experience.
Google emphasizes Core Web Vitals’ significance over other performance indicators, as they are crucial to all web experiences.
Web experience expectations of users may vary depending on site and context, but some remain consistent regardless of where they are on the web.
We can put it this way:
Core Web Vitals are the requirements of all websites to fulfill customer expectations.
Google specifically identifies core user experience needs as loading, interactivity, and visual stability.
And its metrics are:
- Largest Contentful Paint.
- First Input Delay.
- Cumulative Layout Shift
Largest Contentful Paint:
LCP measures load speed and traces the point in the page load timeline when the main page content is likely to load. To provide a good user experience, LCP should occur within 2.5 seconds of page load. For most users, the 75th percentile of mobile and desktop loads is a reasonable threshold to measure to ensure that you meet this target.
As mentioned in the Largest Contentful Paint API, the elements considered are:
- img elements
- img elements inside an svg element
- video elements (the poster image is used)
- An element with a background image loaded via the url() function (as opposed to a CSS gradient)
- Block-level elements containing text nodes or other inline-level text elements children.
First Input Delay:
FID measures responsiveness and measures user experience delay when trying to interact with the page first. Pages should have an FID of under 100 milliseconds to provide a good user experience. To ensure that you meet this target for most users, the 75th percentile of mobile and desktop loads is a good threshold to measure, just like LCP. The FID is the user’s first impression of the response time of your site, and first impressions are critical in forming our overall impression of the quality and reliability of a website.
FID is a metric that measures the response of a page during loading. As such, it focuses exclusively on input events with specific behavior such as clicks, touches, and key presses.
Other interactions, such as scrolling and zooming, are constant actions with entirely different performance restrictions (also, browsers often can hide their latency by running them on a separate thread).
Cumulative layout shift:
CLS measures visual stability and measures the amount of unexpected page content layout shifts. To have a good user experience, pages should maintain a CLS below 0.1.
But what exactly is CLS? Let’s try to understand.
Layout shifts happen whenever a visible entity changes its starting position (e.g., top and left position in the default writing mode) between two frames. Such elements are considered unstable.
Please note that layout shifts only occur when existing elements change starting location. If a new element is added to the DOM or a current element changes size, it does not count as a layout shift as long as the change does not change the starting position of other visible elements.
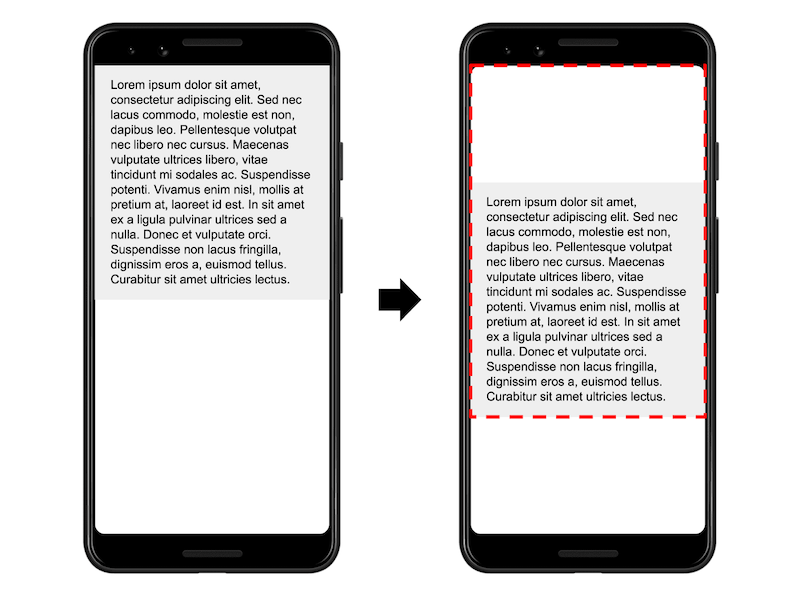
An element in the image above takes half of the view in one frame. Then the element shifts by 25% of the viewport height in the next frame. The red dotted rectangle indicates the union of the visible area of the element in both frames, which, in this case, is 75 % of the entire viewport. Its impact fraction is 0.75.
To calculate the layout shift score, the browser looks at the viewport size and movement of unstable elements between two rendered frames. The layout shift score is a product of two movement measures: impact fraction and distance fraction.
layout shift score = impact fraction * distance fraction
How to measure and report Core Web Vitals?
Following are some of the available tools that support Core Web Vitals and can be used to measure them:
1. Chrome User Experience Report
The Chrome User Experience Report provides metrics for how real-world Chrome users perceive websites.
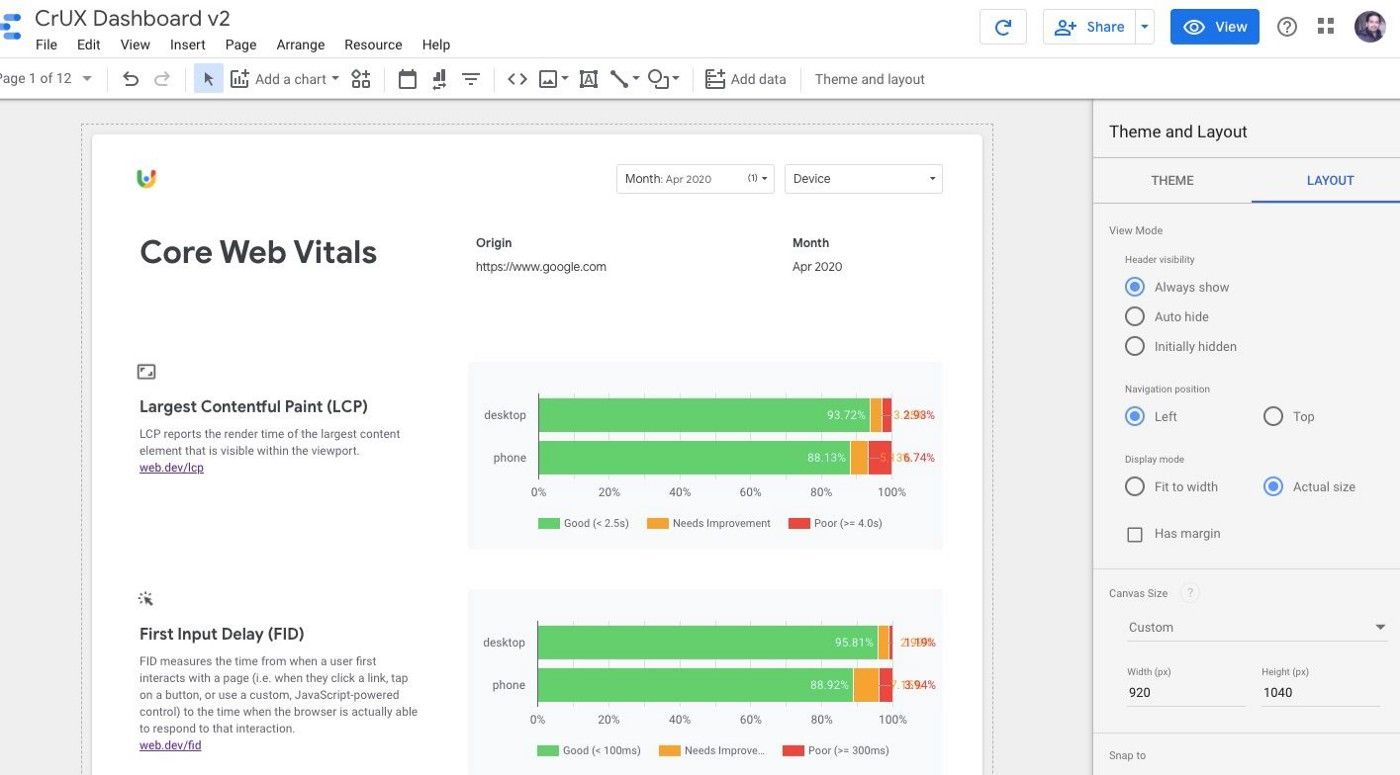
Real user data drive the Chrome User Experience Report metrics. As a result, the results represent the experience of actual users of the visited origin. Compared to virtual or local tests in defined and simulated environments, the result captures the full set of external variables that form and lead to the final user experience.
For example, variations in the population of users with access to a particular origin may contribute dramatically to user experience. If more visitors visit the site with modern devices or through a faster network, the results may appear’ faster’ even if the site is not optimized.’ In comparison, a well-optimized platform that draws a smaller user base or a greater user community on slower devices or networks may appear ‘slow.’
P.S. The Chrome User Experience Report is available as a Google BigQuery public project. To access it, you’ll need a Google Account and a Google Cloud Project.
2. PageSpeed Insights
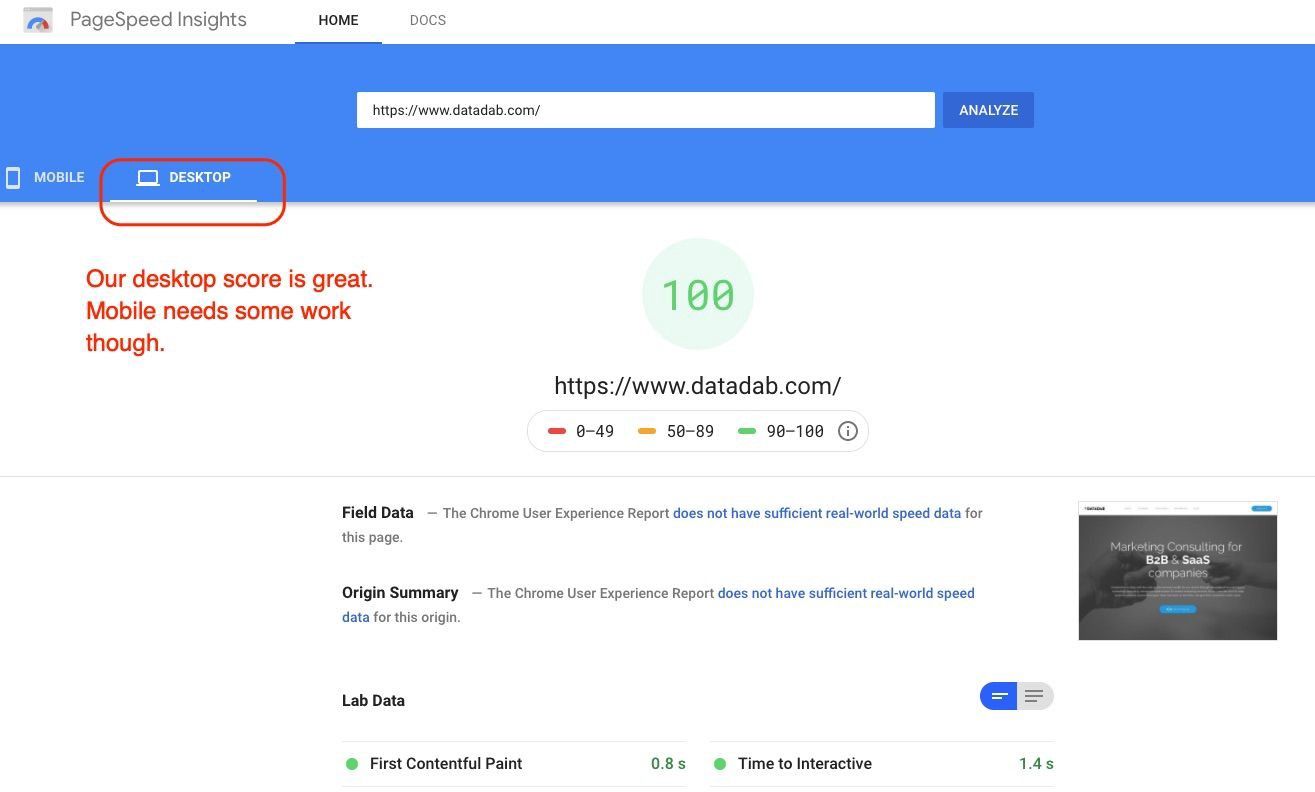
PageSpeed Insights(PSI) is a speed test tool that analyzes the content of a web page, then provides suggestions for speed improvement. PSI has now been upgraded to use Lighthouse 6.0, which enables the measurement of Core Web Vitals in both the report’s lab and field sections.
3. Search Console
The Search Console report shows URL performance grouped by status, metric type, and URL group (groups of similar web pages).
It’s based on three Core Web Vitals metrics: LCP, FID, and CLS. If a URL has no minimum reporting data for any of these metrics, it is omitted from the report. Once a URL has a threshold of data for any metric, the page status is the status of its poorest metric.
4. Lighthouse
Lighthouse is an open-source platform to enhance website performance. You can run it for any webpage, public or private. It has performance audits, usability tests, progressive web app audits, SEO, etc.
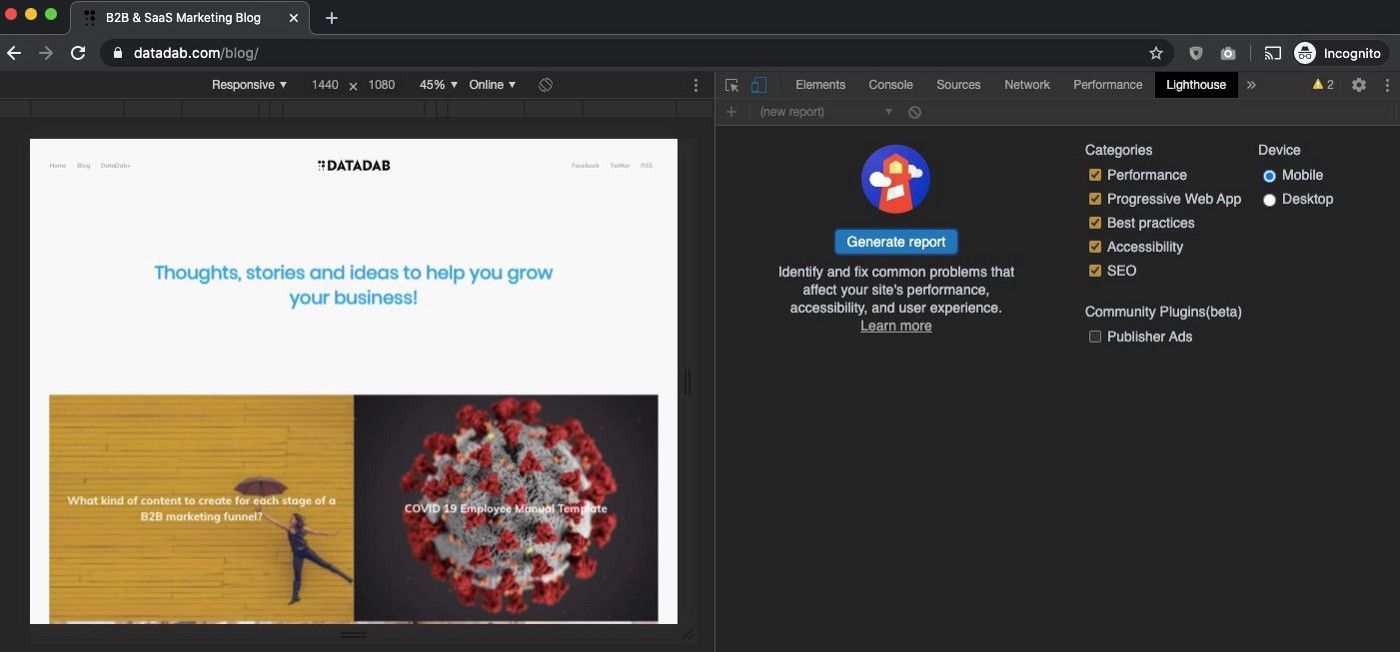
You can run Lighthouse from the command line in Chrome DevTools or as a node module. You give Lighthouse an audit URL, run a series of audits against the page, then generate a report on how well the page did. Use the failed audits as indicators to improve the page. Each audit has a reference doc explaining why and how to fix the audit.
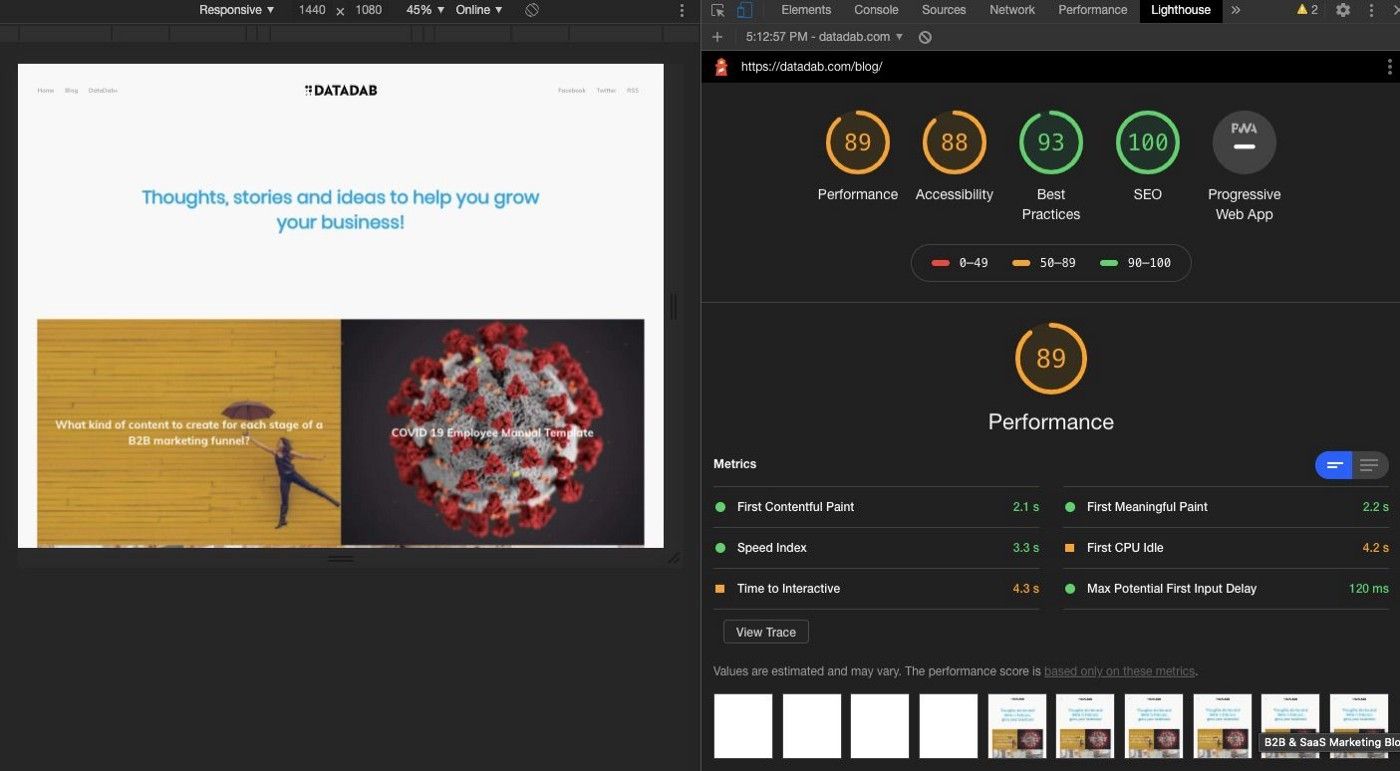
Recently, Lighthouse was updated to version 6.0, which includes additional audits, new metrics, and a new performance score.
5. Chrome Dev Tools
Chrome DevTools is a suite of web development tools directly incorporated into Google Chrome. DevTools can help you quickly edit on-the-fly pages and fix problems to eventually create better websites faster. Chrome DevTools has also been updated to help site owners find and fix visual instability issues on a page that can lead to Cumulative Layout Shift (CLS).
Select a layout shift to view in the Summary tab. To visualize where the change itself occurred, hover over the Move to fields. Chrome DevTools also tests Total Blocking Time (TBT), which is quite useful when optimizing First Input Delay (FID).
TBT is shown in the Chrome DevTools Performance panel footer when testing page performance.
6. Web Vitals Extension
The three core web vitals metrics are now available in a new Chrome extension that you can download here.

This extension measures Core Web Vitals, providing real-time feedback on loading, interactivity, and layout shift metrics. It is consistent with how Chrome tests these metrics and reports to Google’s other tools.
When enabled, it displays a disabled state badge icon before you navigate to a URL. At this point, the green or red badge will be updated depending on whether the URL passes the Core Web Vitals metrics thresholds.
The badge has several states:
- Disabled-brown
- Passing green
- Failing one or more metrics-red
If one or more metrics malfunction, the badge will animate such metrics.
You can even create your own custom Python scripts to automate performance metrics measurement. But that could be a topic for another post maybe. :-)
FAQs
Frequently asked questions related to Core Web Vitals
What are the 3 pillars of Core Web Vitals?
Core Web Vitals are a set of metrics that measure the user experience of a website. The 3 pillars of Core Web Vitals are:
- Speed: This includes metrics such as First Contentful Paint (FCP) and Time to Interactive (TTI), which measure how quickly a page loads and becomes interactive for the user. FCP measures the time from when the user requests a page to when any visible content is rendered on the screen. TTI measures the time from when the user requests a page to when the page becomes fully interactive. These metrics are important because they determine how quickly users can access and interact with the content on a website.
- Responsiveness: This includes metrics such as Total Blocking Time (TBT) and Cumulative Layout Shift (CLS), which measure how smoothly the page responds to user interaction and how stable the layout is. TBT measures the time the main thread is blocked by JavaScript and other tasks that prevent the page from becoming interactive. CLS measures the visual stability of the page, which is important for providing a smooth user experience. These metrics are important because they determine how responsive a website is to user interactions, which can affect user engagement and satisfaction.
- Visual stability: This includes metrics such as Cumulative Layout Shift (CLS), which measures how stable the layout is when elements on the page change or load. CLS measures the visual stability of the page, which is important for providing a smooth user experience. This metric is important because a website with poor visual stability will have a jarring user experience, which can lead to high bounce rates and low user engagement.
Why is Core Web Vitals important?
Core Web Vitals are important because they measure the user experience of a website, which is a critical factor in determining a website's success. A website with poor Core Web Vitals scores will likely have a higher bounce rate, lower conversion rates, and lower search engine rankings. User experience is a key element in determining how users engage with a website and how likely they are to come back and recommend it to others. Additionally, poor user experience can lead to high bounce rates, lower conversion rates, and lower search engine rankings.
Moreover, Google has stated that Core Web Vitals will be a ranking factor in search results, so it's important for website owners to pay attention to and improve their Core Web Vitals scores. The better the user experience, the higher the chances of ranking higher on search engine results. This can increase website traffic, leading to increased conversions, sales, and revenue.
Is Core Web Vitals technical SEO?
Core Web Vitals are a technical aspect of SEO, but they are not the only aspect. While Core Web Vitals focus on measuring the user experience of a website, other technical SEO factors include things like site structure, mobile-friendliness, and page load speed. Improving Core Web Vitals scores can help improve a website's overall technical SEO and search engine rankings. Technical SEO is a set of practices that help search engines understand and crawl a website, and it plays a crucial role in determining how well a website performs in search results. Core Web Vitals are a subset of technical SEO that specifically focus on measuring user experience.
How do I run Core Web Vitals?
There are several tools available to help measure Core Web Vitals. Google provides a few options, such as the Lighthouse tool, which can be run in the browser or through the command line, and PageSpeed Insights, which provides a report on the Core Web Vitals of a specific URL.
Other third-party tools such as WebPageTest, GTmetrix, and Chrome DevTools can also be used to measure Core Web Vitals.
To use these tools, simply enter the URL of the page you want to test, and the tool will provide a report on the Core Web Vitals scores for that page. The report will also provide recommendations on improving the scores, such as reducing the size of images, minifying code, and reducing the number of JavaScript and CSS files.
Measuring Core Web Vitals regularly ensures that the website always provides the best user experience possible. And that's why it's important to set up automated monitoring of these vitals and regularly check them. Some website monitoring service providers offer this feature as part of their services.
Test your website on different devices and browsers to ensure that the user experience is consistent across all platforms. This can be done by using browser testing tools or by manually testing the website on different devices.


