

If you're anything like me, you're a sucker for well-crafted content that actually performs. You don't just want to pump out blog posts, whitepapers, or case studies—you want them to work. I get it, and frankly, that's where many of us hit a wall.
Because let's face it, the usual metrics like page views, shares, or likes? Meh. They only scratch the surface. I want to talk about those sneaky, sometimes overlooked metrics that dig deeper. Metrics that go beyond just counting eyeballs on your content and get down to what’s actually driving value for your SaaS business.
I mean, if we're going to invest our time, energy, and, most importantly, our budget into content, we’d better know it’s working. Not just in the “Oh, it got a thousand page views” kind of way, but in the “This drove 40% more conversions for our top-tier product” kind of way. That’s where it gets exciting.
So, let's go beyond the usual suspects and explore the real game-changers when it comes to SaaS content performance metrics. No fluff, no run-of-the-mill advice—just deep, nuanced insights that can make a difference to your bottom line.
The Problem With Basic Metrics
You've seen the typical dashboard before: page views, bounce rate, average time on page. It’s like Content 101. And sure, these metrics do have their place. They tell you if someone landed on your page and whether they left in a hurry or stayed for a while.
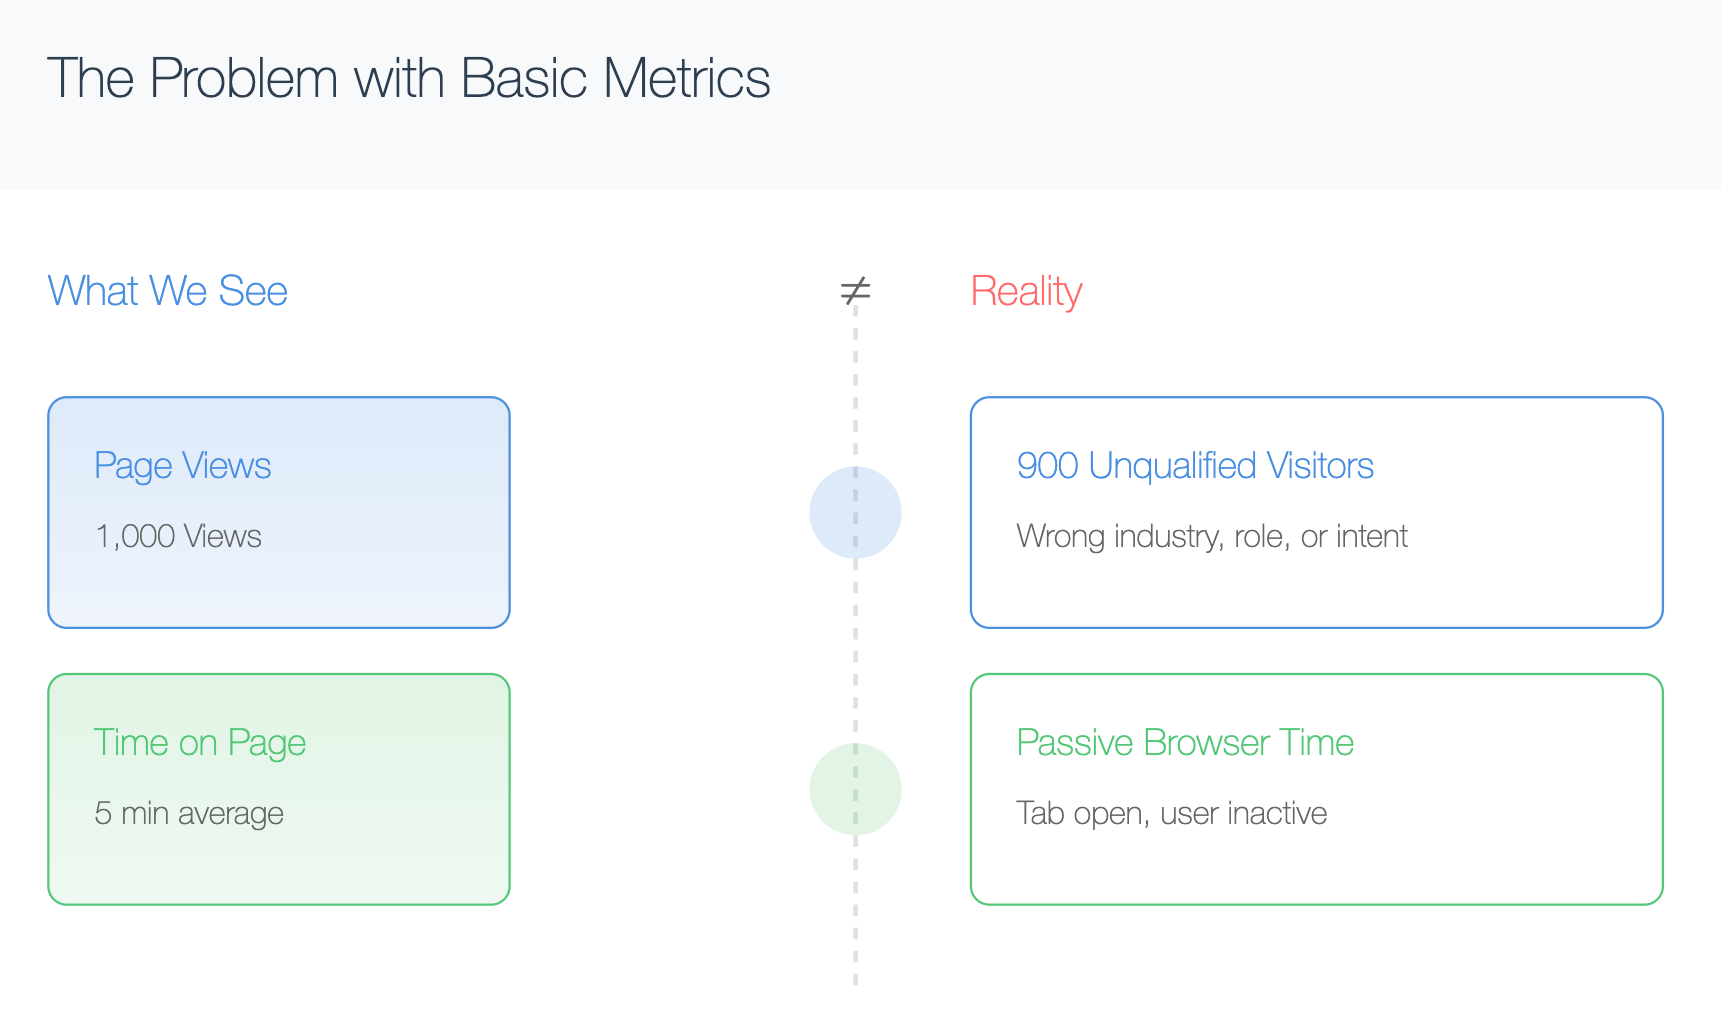
But think about this—a page view tells you someone was there. It doesn't tell you if they were the right someone. It doesn’t tell you if they’re ready to try out your free trial, if they even know what your product does, or if they’re ready to buy. Same goes for bounce rate. Just because someone left doesn't mean your content failed; maybe they found exactly what they were looking for. Or maybe they bounced because your sign-up process is hidden somewhere in the back alleys of your website.
We need more. We need to peel back the layers and understand what content actually gets your target audience to act. To do that, we’ll have to delve into metrics that bridge the gap between content engagement and true business impact.
Qualified Traffic and Audience Fit
We can’t start talking about the good stuff without addressing qualified traffic. Sure, 10,000 page views on your latest blog post might look good, but if it’s 10,000 teenagers who aren’t going to buy your B2B SaaS product, it’s...well, kind of useless.
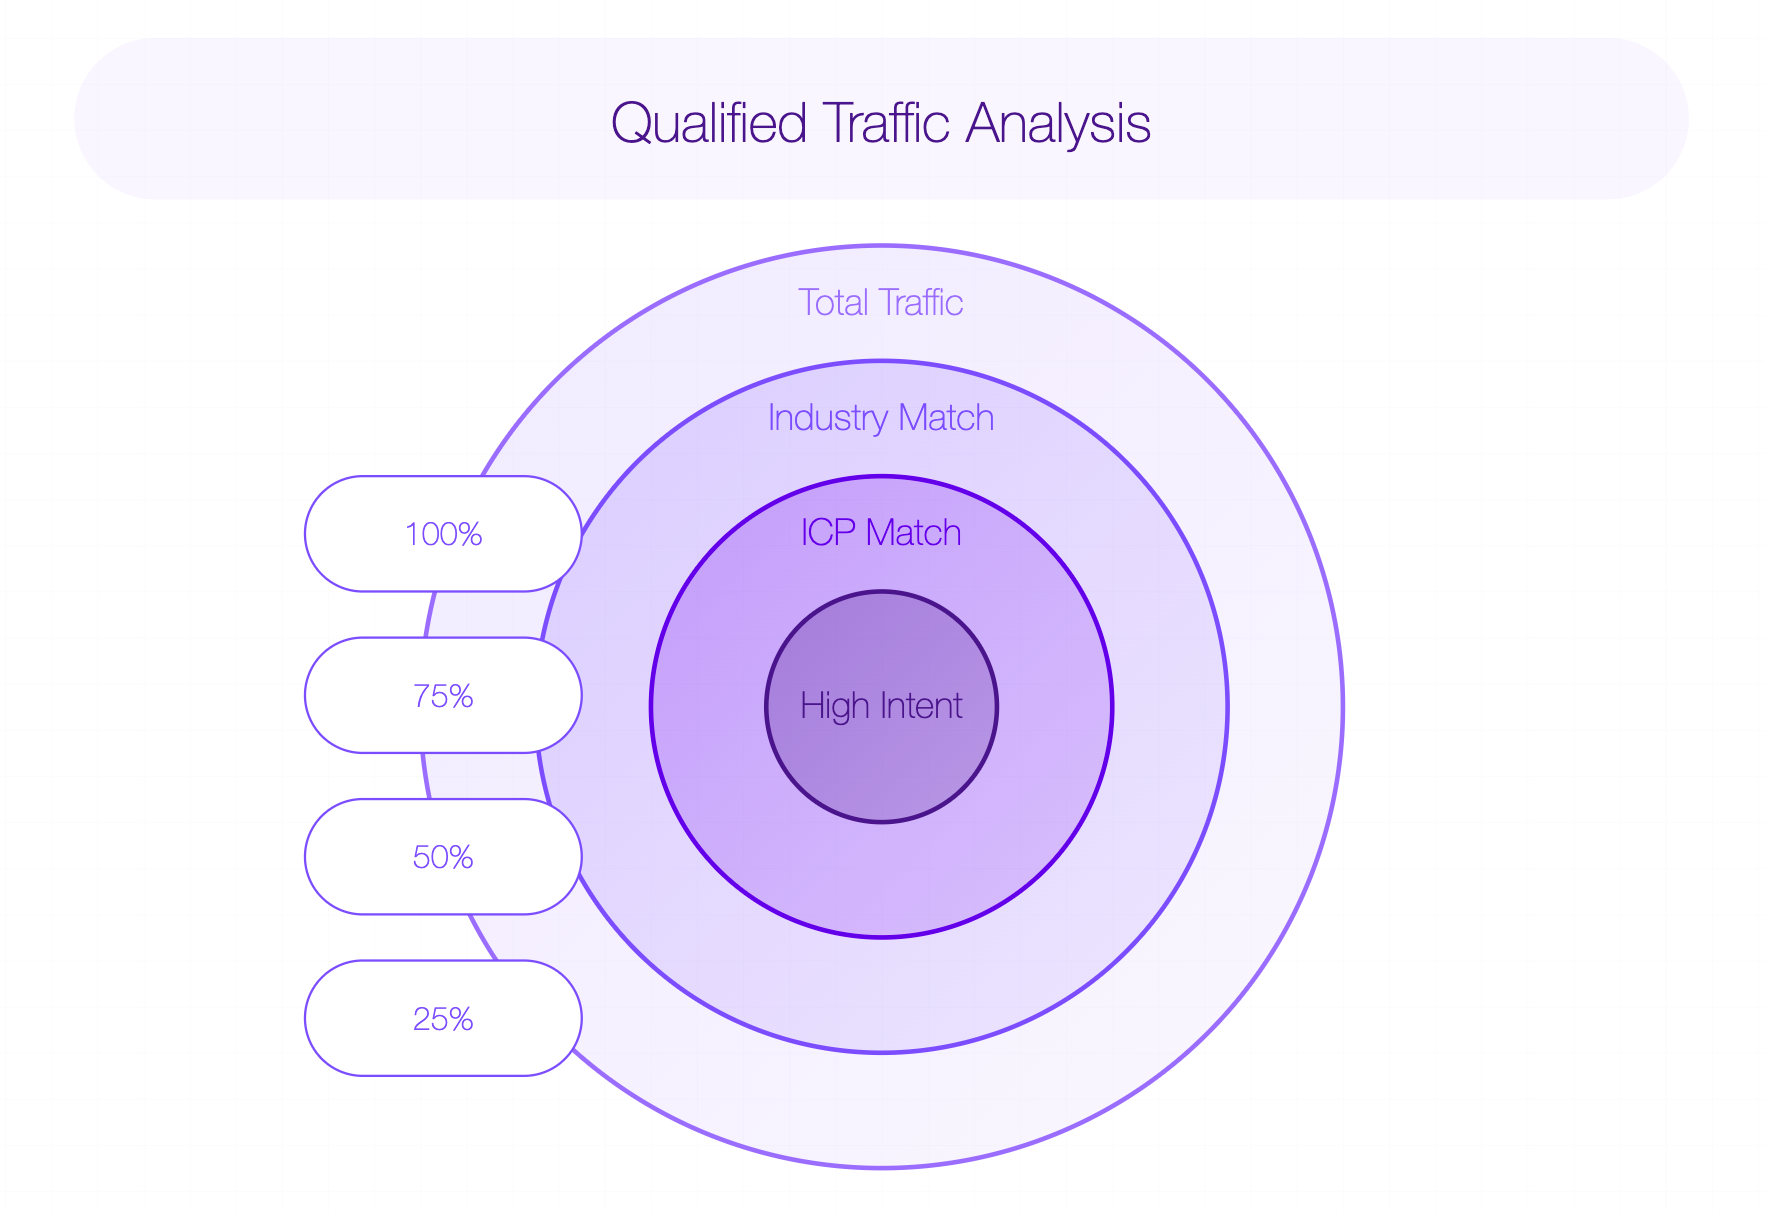
Instead of just raw traffic numbers, focus on metrics that reflect audience fit. For example, check how much of your traffic is coming from sources where your target audience hangs out—think LinkedIn for enterprise clients or specialized forums for niche SaaS products. Use tools like Google Analytics to segment traffic by referrer. If you're seeing quality traffic from targeted campaigns or high-ROI sources, that’s a win.
| Source | Traffic Volume | Qualified Leads | % Qualified | Conversion Rate |
|---|---|---|---|---|
| 5,000 | 400 | 8% | 3.5% | |
| Specialized Forum | 3,000 | 1,500 | 50% | 10% |
| 7,500 | 200 | 2.7% | 1.2% | |
| This table shows how to evaluate traffic by its quality and fit, supporting discussions on understanding qualified traffic. |
Also, look at User Persona Enrichment through tools like Clearbit or Albacross, which can help reveal whether the visitors you’re attracting match your ideal customer profile. In other words, don’t just care about the number of fish in the pond; care about the type of fish you’re reeling in.
Another goodie? Engagement metrics filtered by firmographic data. If you’re selling to mid-sized manufacturing companies, seeing deep engagement from finance bloggers is less useful than knowing exactly how many mid-sized manufacturers read, clicked, and engaged. It’s about precision, and it’s achievable with tools that help you bring content engagement in line with customer profiles.
Content-Assisted Conversions
The holy grail of SaaS metrics? Conversion. And content plays a huge role here, but it’s rarely a direct, single-touch journey. Instead, most SaaS companies thrive on content-assisted conversions.
When you look at your conversion path, you'll often find that the whitepaper someone downloaded two months ago was the initial spark that led to a demo request last week. Traditional tools like Google Analytics don’t often give content enough credit. Instead, you need to shift your focus to content-assisted conversion tracking.
This involves tracking which pieces of content contributed to a customer journey. Tools like HubSpot, Pardot, or even Google Tag Manager allow you to build attribution models that give credit to the content touchpoints that nudged someone closer to the decision-making phase.
To add nuance, break conversions into micro and macro levels. Micro conversions include signing up for newsletters, downloading a guide, or clicking on a call-to-action. Macro conversions could be signing up for a free trial, booking a demo, or subscribing to a paid plan. The key is to understand how each blog post, webinar, or case study adds value at different stages of the funnel.
A solid attribution model will show you whether that blog post you wrote three months ago is quietly nudging 20% of your customers towards a sale. This might just be one of the most powerful content performance metrics out there, and it's shockingly underutilized.
Content Score: A Composite Metric for Success
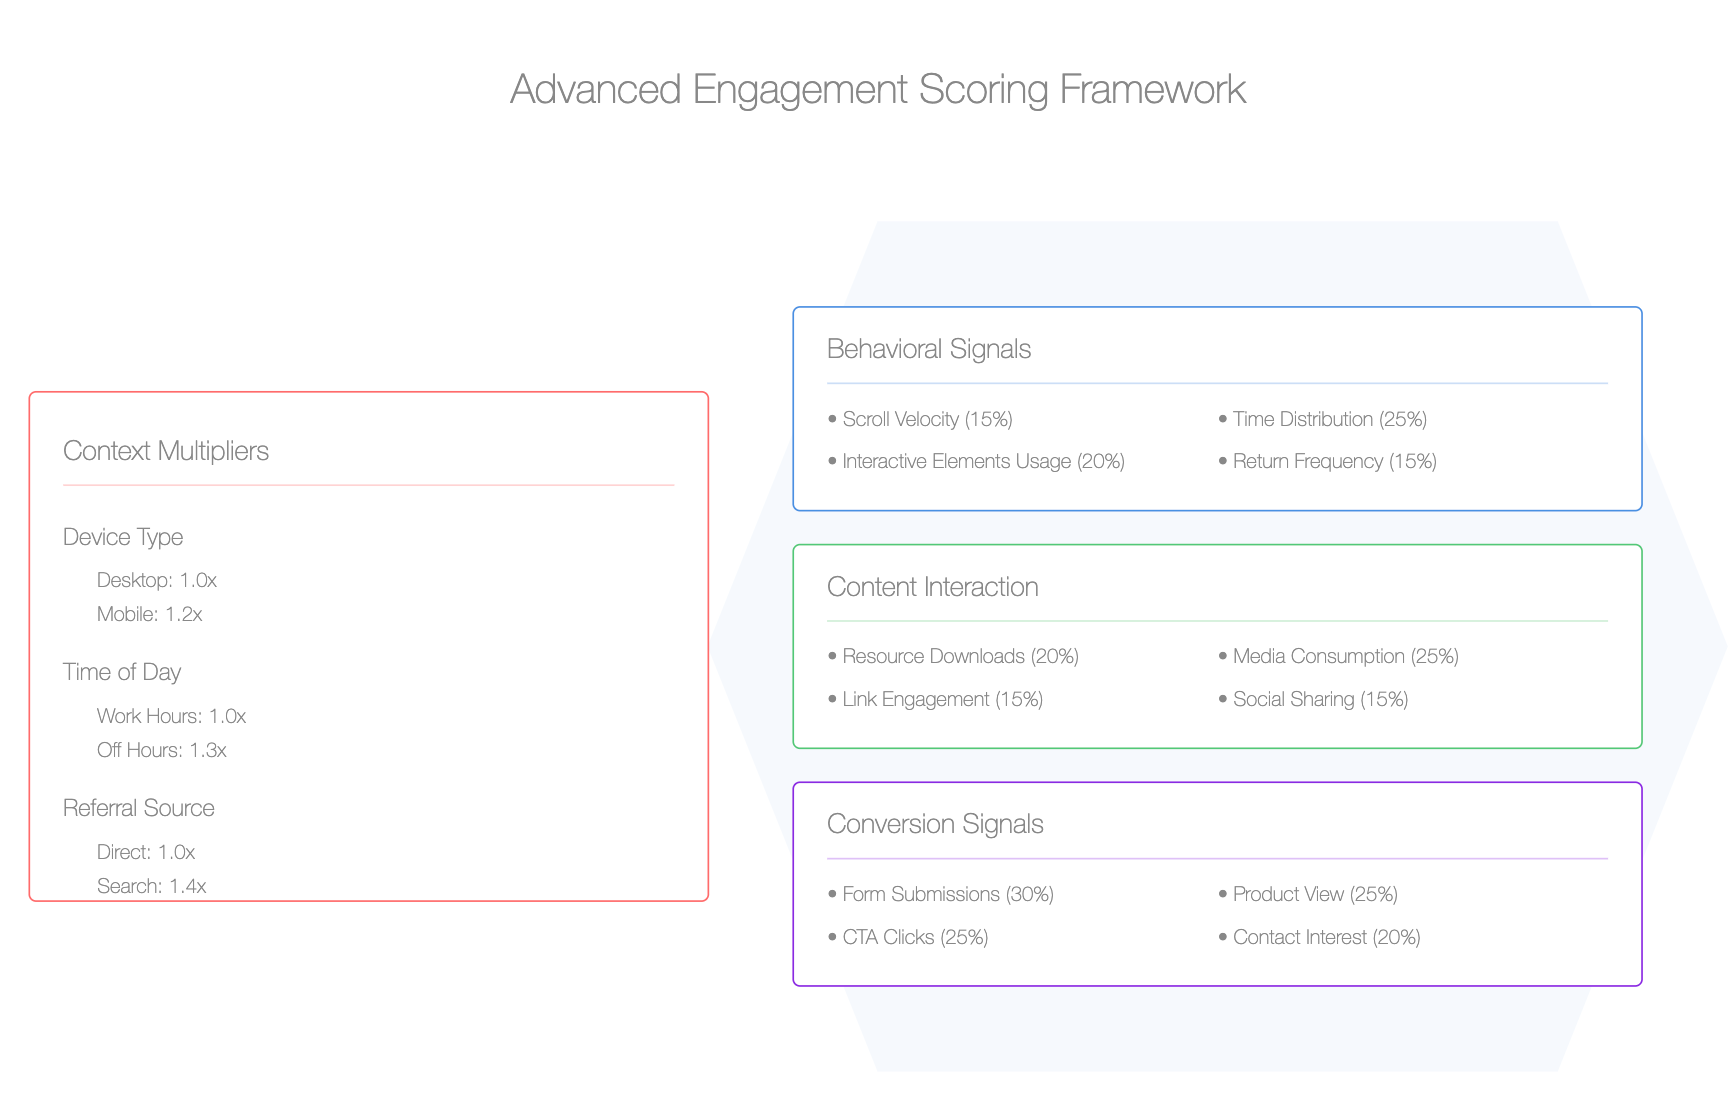
The "Content Score" is a concept that might be a little new, but it’s invaluable. A Content Score helps you create a composite picture of how your content is performing, beyond individual metrics like time on page or bounce rate. It’s a way of boiling down multiple dimensions of content performance into a single, interpretable metric.
To create a content score, you can combine factors like:
- Engagement (Average Time on Page, Scroll Depth)
- Conversion Actions (CTA clicks, form fills)
- Relevance (Bounce Rate, Audience Persona Match)
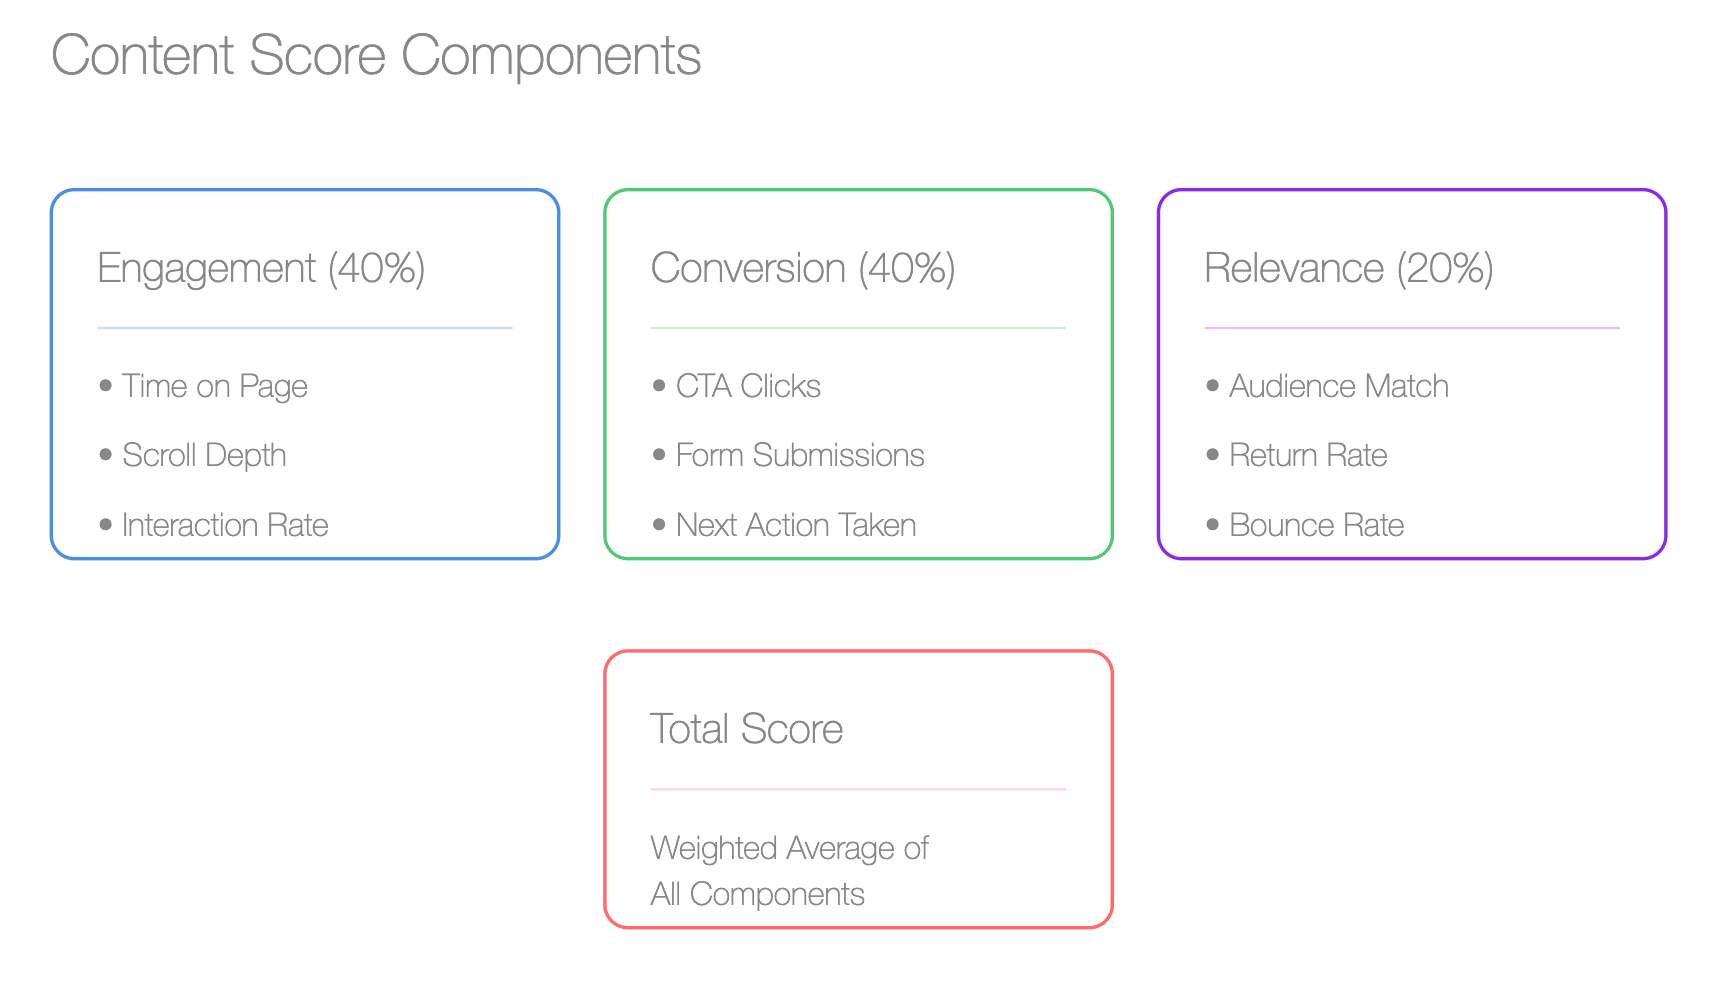
Each factor can be given a specific weight depending on its importance to your strategy. For example, if your primary goal is lead generation, you might want to heavily weight conversion actions.
Let’s say you assign a weight of 40% to engagement, 40% to conversions, and 20% to relevance. Assign scores out of 10 for each category. If a blog post has high engagement (9/10), moderate conversions (5/10), and moderate relevance (6/10), you can calculate a composite score to determine its overall performance.
This approach helps you move beyond just looking at siloed metrics, which don’t always tell the whole story. It’s the holistic, SaaS-friendly equivalent of grading your content’s effectiveness.
Visitor Intent and Buyer Journey Alignment
Visitor intent is one of those things that can make or break a content strategy. There’s a difference between someone who’s casually browsing and someone who’s actively searching for a solution—and being able to measure and respond to that intent is gold.
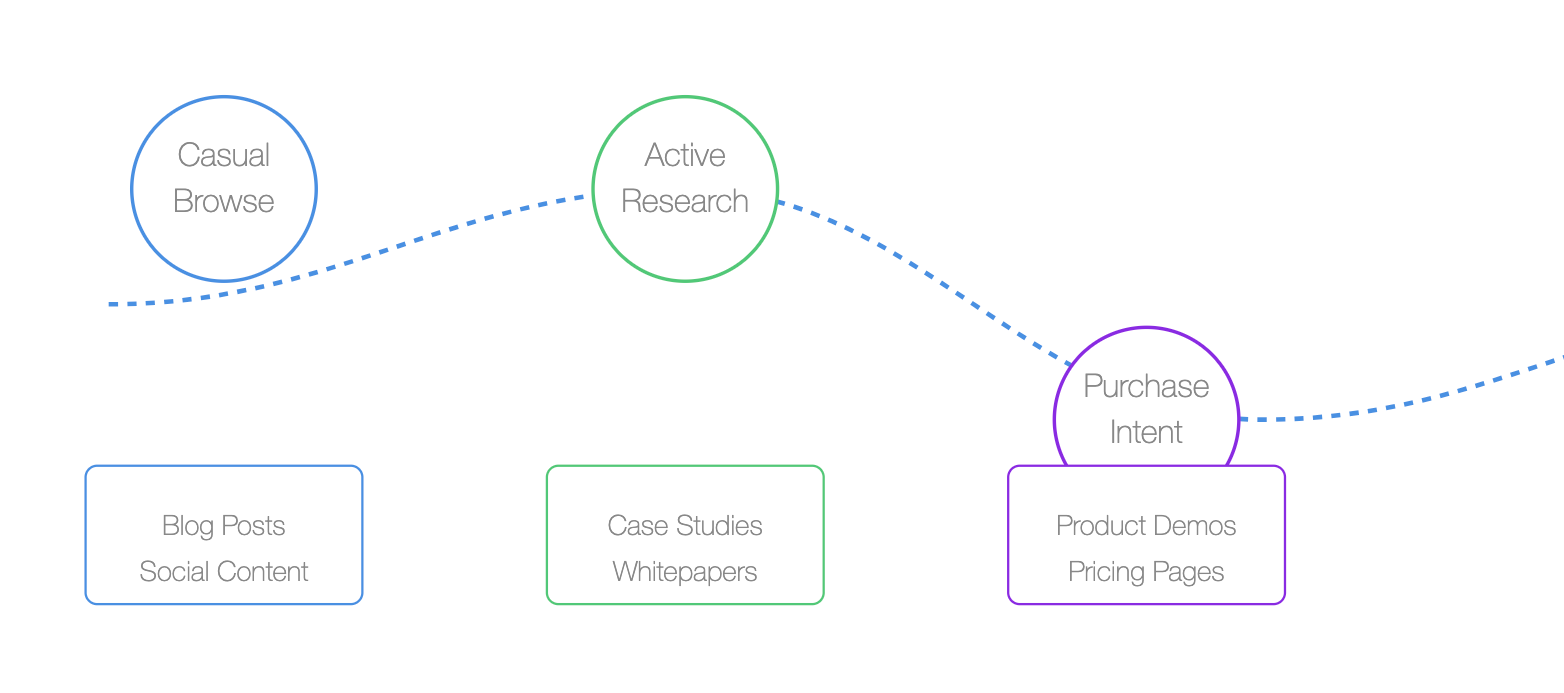
To understand intent better, you can use tools like Hotjar or Crazy Egg to see where visitors are clicking, scrolling, and how they navigate through your website. For example, if someone lands on a blog post and navigates directly to your pricing page, that’s an indicator of high purchase intent.
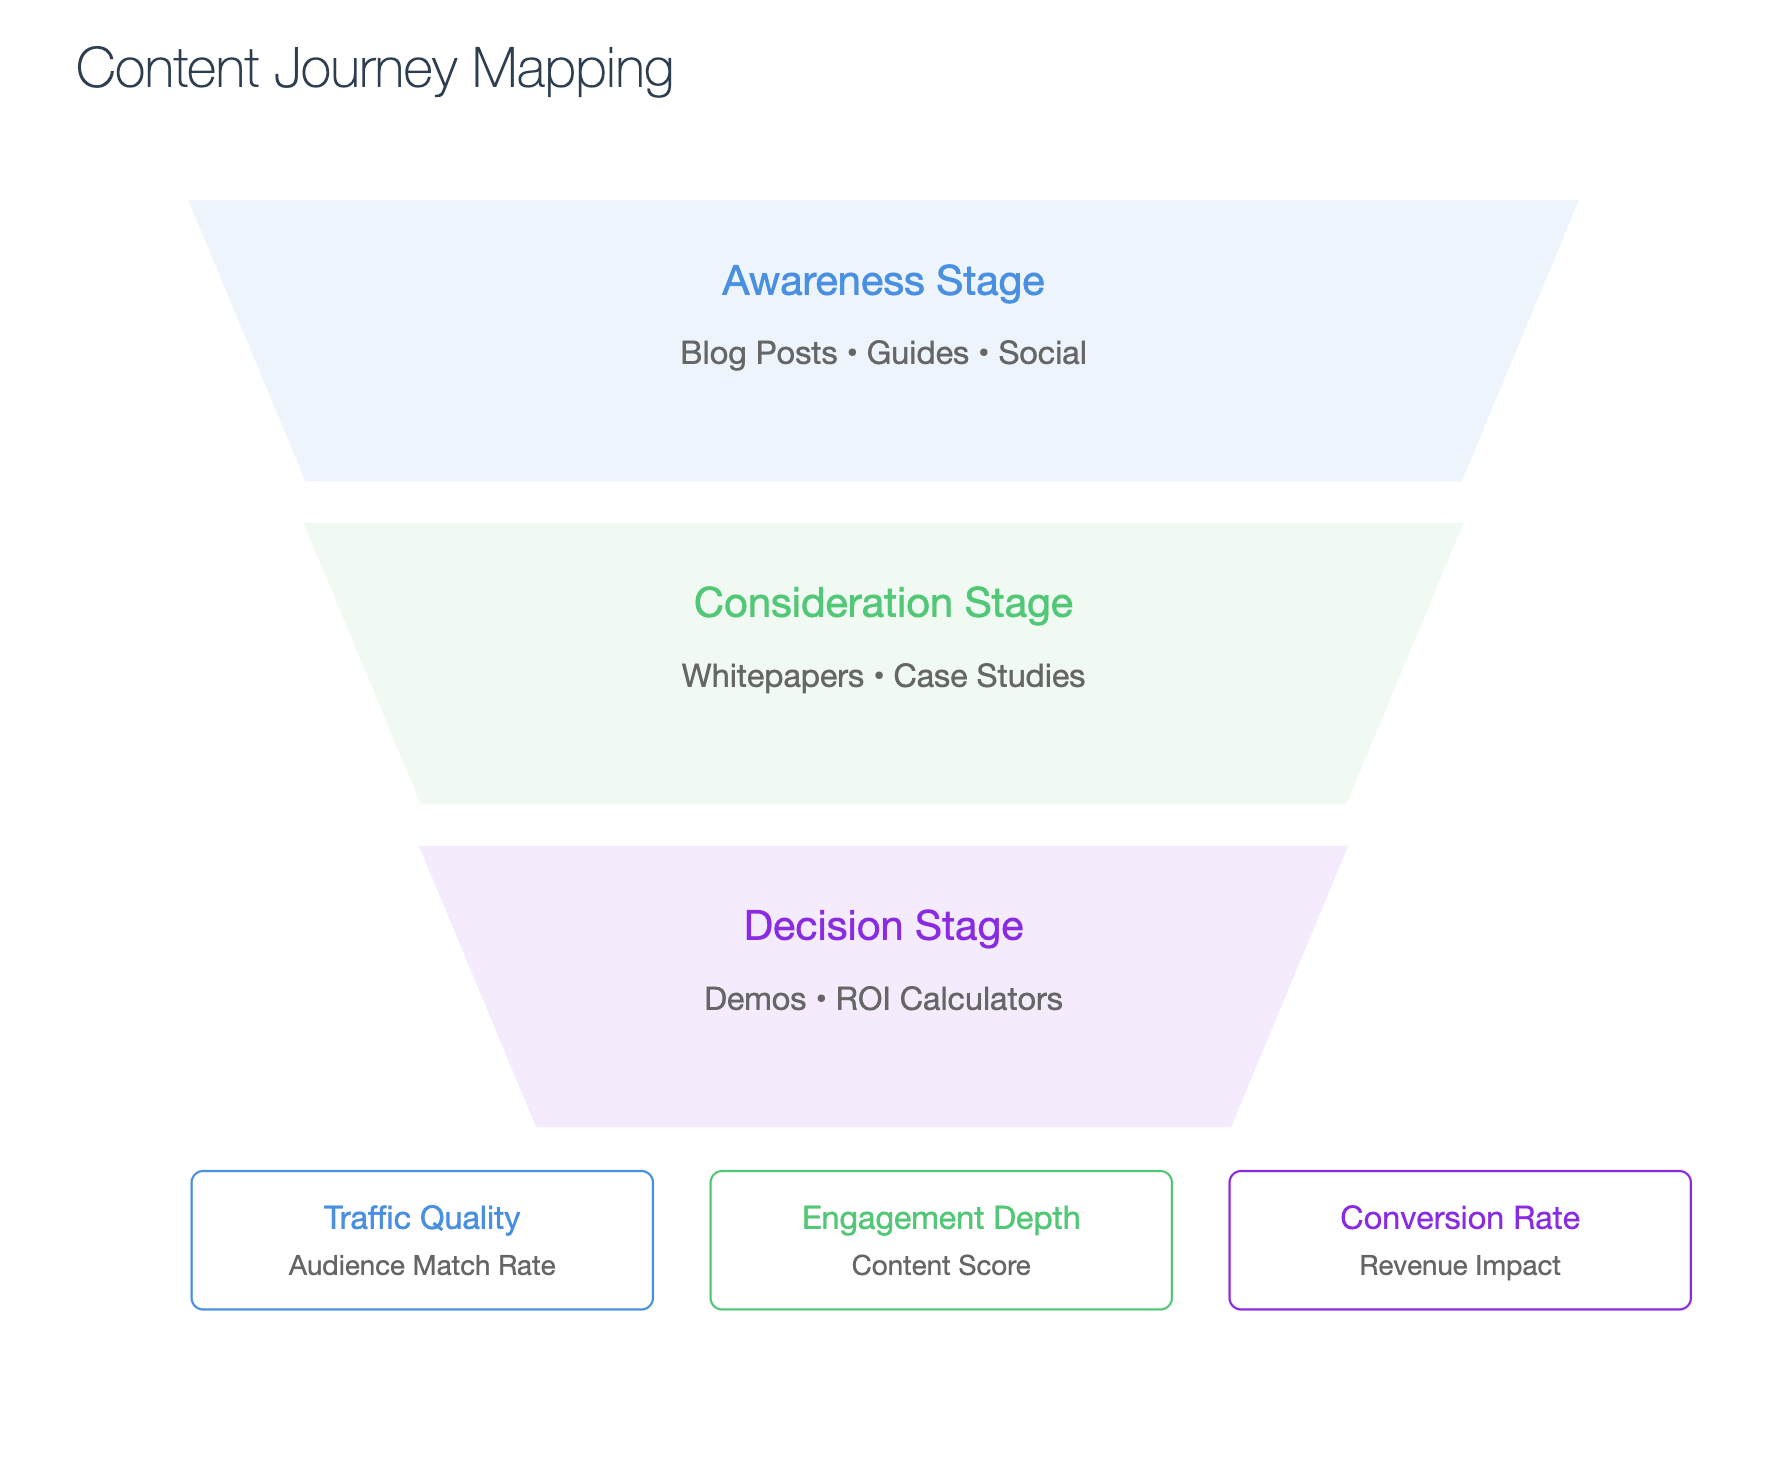
Another good metric here? Content Journey Mapping. This means tracking how users progress from awareness content to decision-making content. If your awareness content is bringing in new leads, but they’re not moving towards product-centric pages, there’s a disjointedness that needs fixing. Understand whether the hand-off from content piece to content piece is clear. Are people moving from high-funnel blogs to case studies, and then to pricing or demo requests? Or is there a massive fall-off where people just disappear? This flow can be visualized using attribution tools like HubSpot or Kissmetrics.
And let’s not forget the power of behavioral segmentation. Grouping visitors based on the actions they take and serving up more personalized content makes your SaaS brand stand out. Behavioral email triggers can convert content consumers to users. Your intent metric should align tightly with your content personalization strategy.
Engagement Quality Over Quantity
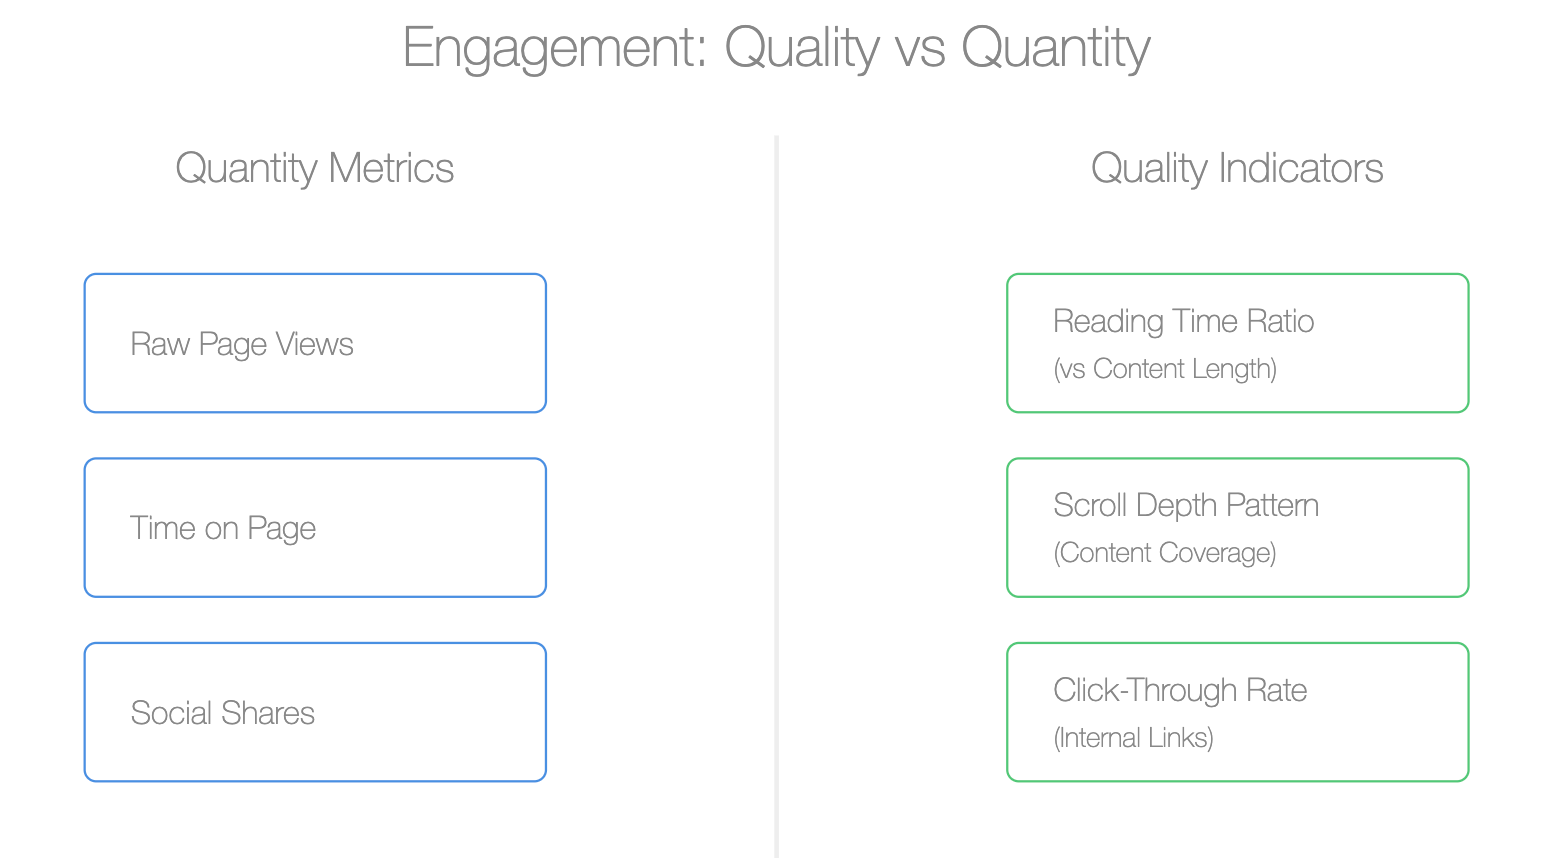
Engagement metrics like time on page, bounce rate, and scroll depth are fairly commonplace, but they’re also ripe for misinterpretation. Not all engagement is good engagement, and quantity doesn’t always equal quality.
One metric that’s useful here is the ratio of time spent to content length. If people are spending 4 minutes on a 3,000-word article, they’re probably not reading it carefully. Or, if a high percentage of visitors stop scrolling midway, maybe your article’s introduction is a bit of a snooze-fest.
| Content Piece | Word Count | Average Time Spent | Engagement Ratio (Time/Length) |
|---|---|---|---|
| Blog Post X | 1,500 | 2:30 mins | 1:00 per 600 words |
| Guide Y | 3,000 | 3:00 mins | 1:00 per 1,000 words |
| This table helps understand if users are meaningfully engaging with the content based on time spent vs. content length. |
Another often overlooked, but insightful, engagement metric is click-throughs on in-line links or resource suggestions. If you see that people are clicking through to your internal product pages from a piece of content—especially multiple times—that's a strong indicator that your content is engaging the right way.
Additionally, scroll maps and heatmaps can give you data on how far down the page people are getting. Tools like Hotjar or Crazy Egg can highlight engagement drop-off points, revealing not just whether people engage, but where they stop and why. Maybe your CTA button is too far down, or maybe your subheadings aren’t compelling enough to keep people scrolling.
Lead Scoring Based on Content Consumption
In SaaS, there’s rarely one magical piece of content that convinces a lead to convert. It’s a journey. And lead scoring based on content consumption is a great way to add depth to your content metrics.
Consider assigning scores to users based on the type of content they consume. For example, someone who reads a “Getting Started” guide might score lower than someone who reads an ROI case study and then requests a demo. A lead who opens three emails containing high-funnel content might get 10 points, whereas one who attends a product webinar might get 50 points.
This scoring method helps you identify which leads are warming up based on what content they consume, and ultimately, it allows you to automate outreach more intelligently. You could even build a Content Consumption Scorecard—a way to visualize how content is pulling leads down the funnel.
This scoring can get even more nuanced if you include firmographic factors—like whether a lead’s company fits your ideal client profile—into the score. This ensures that your lead scores reflect both engagement quality and strategic fit.
Real User Feedback Through Surveys and Direct Engagement
Numbers and analytics are great, but real user feedback can be a goldmine for understanding content effectiveness. SaaS companies often shy away from surveys or direct user interviews, but it’s one of the best ways to go beyond the basics.
Consider short post-engagement surveys. These don’t need to be cumbersome; a simple pop-up with “Was this content helpful?” or “What would you like to see next?” can provide direct insights into how users perceive your content.
Another effective way to gauge content performance is to encourage discussion. Platforms like Disqus or simply comments on your blog can help you engage directly with readers. See if they have questions. The more interaction, the higher the chance you’re addressing genuine customer pain points.
This qualitative data, combined with more quantitative metrics, gives a rounded perspective. It tells you not only what happened but why it happened, providing you the context to make data-driven decisions that are still informed by real human feedback.
Content Efficiency Metrics: The Hidden ROI
Another often neglected metric is the efficiency of your content production relative to its impact. Let’s call it the “content efficiency ratio.” In SaaS, where resources can be tight, you need to know if that epic, 5,000-word blog post that took 40 hours to produce is performing better than a quick 1,000-word article that took just 8 hours.
| Content Piece | Hours Invested | Leads Generated | Efficiency Score (Leads/Hours) |
|---|---|---|---|
| Long Blog Post | 40 | 100 | 2.5 |
| Quick Article | 8 | 20 | 2.5 |
| Video Tutorial | 50 | 150 | 3.0 |
| This table supports the discussion on content efficiency by comparing content types based on resource investment versus output. |
To calculate content efficiency, take the total impact—like traffic, lead conversions, or even revenue—and divide it by the resources spent. The resource metric could include hours worked, money spent, or even the cost of external contributors. If a piece consistently delivers leads but took minimal resources to produce, it's high efficiency, and that tells you something about how to prioritize future content efforts.
Efficiency doesn’t always mean producing less—sometimes, it means investing in the right type of high-effort content. But knowing your efficiency metric will help you optimize for both short-term gains and long-term plays.
A/B Testing Content CTAs and Messaging
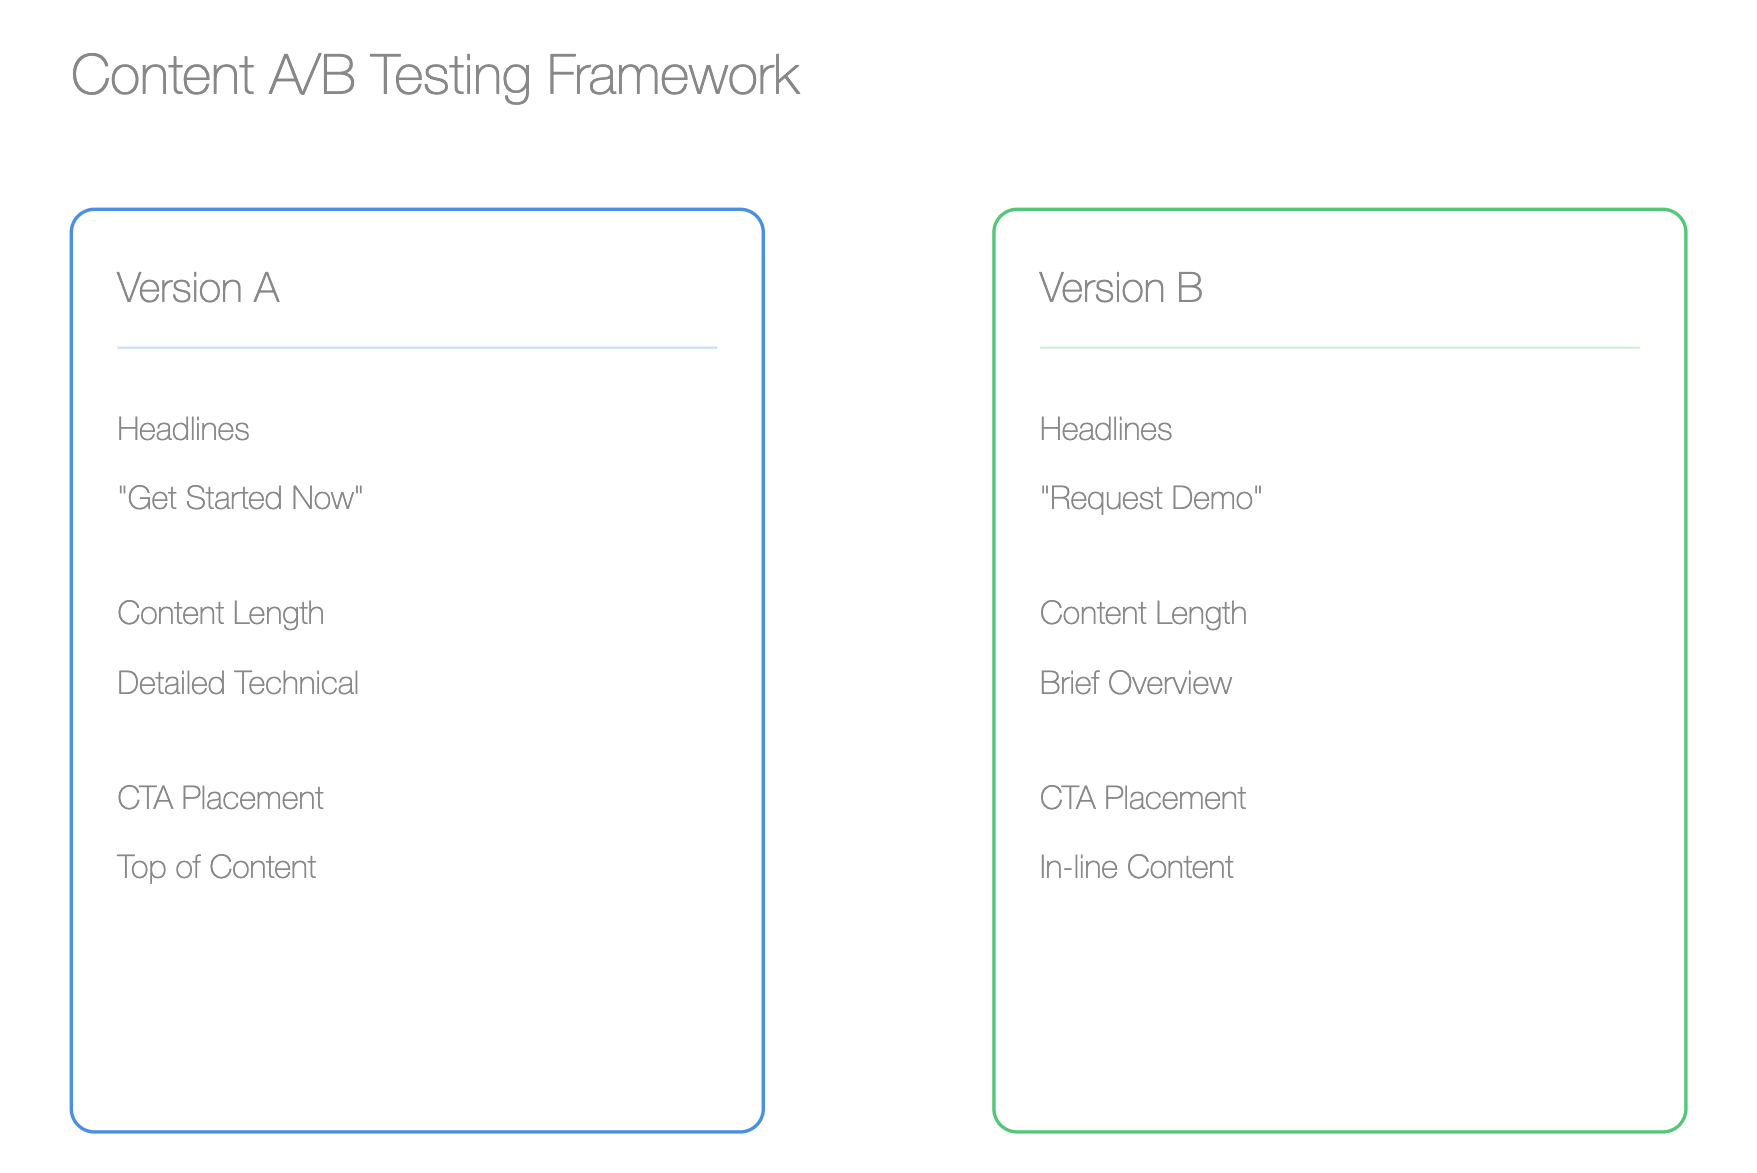
This might seem a bit tactical, but testing content can provide profound strategic insights. For SaaS, A/B testing isn’t just for landing pages; it’s also for content.
Testing CTAs within content can show you which wording drives more users to the next step. A button saying “Get Started” may work better for top-of-funnel readers, while “Request a Demo” might resonate more for middle or bottom-funnel audiences. Beyond CTAs, test headlines, section orders, or even the depth of content. Do audiences convert more when you give them all the data upfront, or when you break it down?
The insights you gain from these tests can feed into other parts of your strategy—improving landing pages, email campaigns, or even product messaging. Tools like Optimizely, Google Optimize, or even HubSpot’s built-in features are good places to start for content A/B testing.
Wrapping It Up
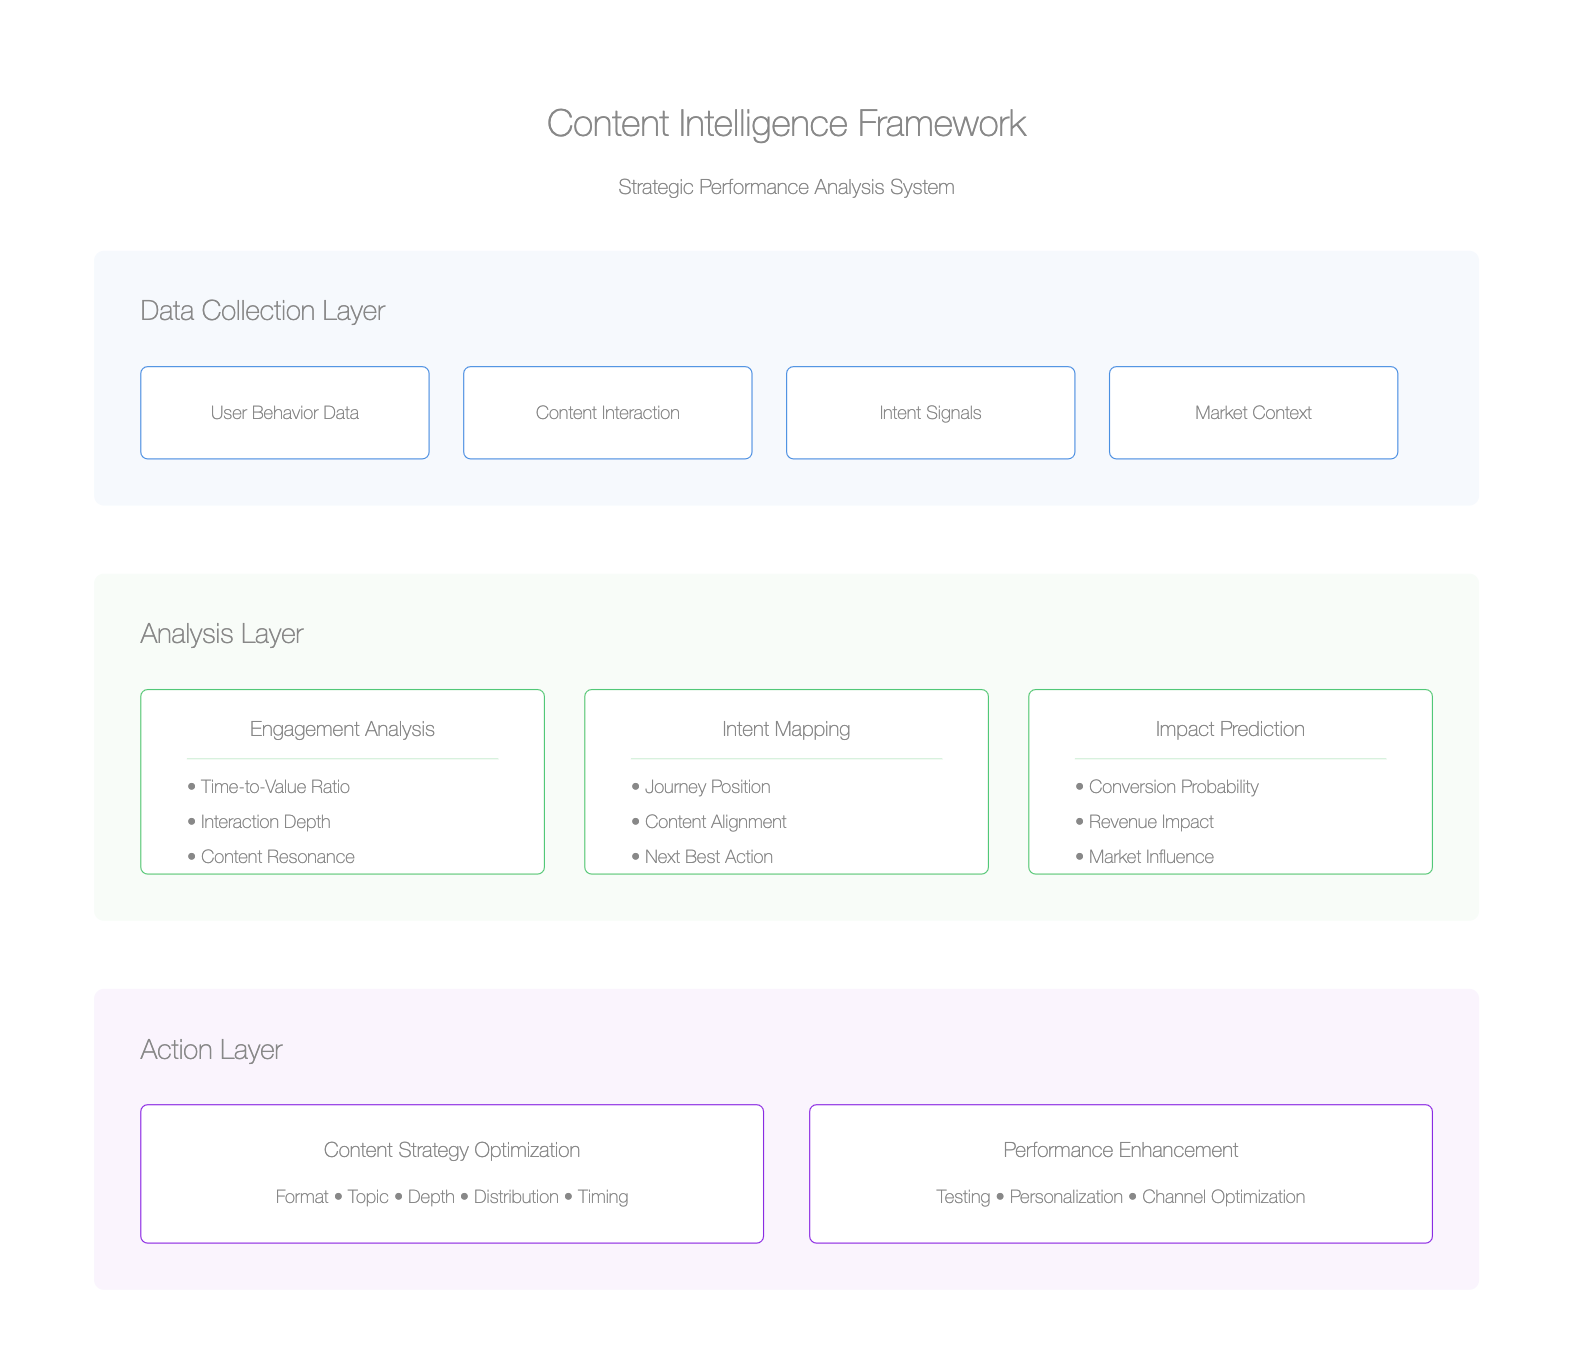
In SaaS, measuring content performance is about much more than just counting the clicks or eyeballs. It’s about understanding the journey—identifying the right audience, nurturing intent, scoring leads, and even figuring out how efficiently you’re creating the content itself.
Go beyond page views, bounce rates, and time-on-page metrics. Dig into user personas, assisted conversions, and efficiency ratios. Start scoring leads on their content interactions, track their journey, and don't be afraid to get real feedback straight from the horse's mouth.
After all, your content isn’t just a bunch of words sitting on a page; it’s a living, breathing part of your marketing funnel. And the deeper you can go in understanding how it performs, the better you'll be at crafting content that doesn’t just get read—but that drives real, measurable growth for your SaaS.
I'd love to hear from you—which of these metrics have you been using, and which ones do you think will make the biggest difference for your SaaS content strategy? Drop a comment below, and let’s get the conversation rolling!
FAQ
- Why should I go beyond basic metrics like page views and bounce rate?
Basic metrics like page views only tell you that someone visited your page. To assess the true value of content, you need metrics that measure if the visitor was the right audience and whether they took meaningful actions. Look at metrics like qualified traffic, engagement depth, and content-assisted conversions for deeper insights. - What is “qualified traffic,” and how do I measure it?
Qualified traffic refers to visitors who match your target audience and are likely to convert. Use tools like Google Analytics to segment traffic by source and tools like Clearbit to understand the user personas and identify whether your content is attracting the intended audience. - How can I measure content-assisted conversions effectively?
Content-assisted conversions track the role content plays across the customer journey. Tools like HubSpot and Google Tag Manager can be used to set up content attribution models that assign credit to each piece of content based on how it contributed to conversion. - What is a Content Score, and how can I use it to measure performance?
A Content Score is a composite metric that evaluates content based on multiple factors, such as engagement, conversions, and relevance. You can create this score by assigning weights to different factors, allowing you to get an overall performance snapshot that goes beyond siloed metrics. - How do I understand visitor intent and align it with the buyer journey?
To understand visitor intent, use tools like Hotjar to track user behavior, such as clicks and scrolls. If users navigate directly to key pages like pricing, this indicates high intent. Also, ensure your content flow is logical, so users can smoothly transition through different stages of the funnel. - How can I determine whether my content engagement is of high quality?
High-quality engagement isn't just about time on page but about meaningful actions. Check the ratio of time spent versus content length and see if users are clicking on relevant internal links. Tools like heatmaps can also help identify whether your content is engaging users in a way that drives them to the next step. - What is lead scoring based on content consumption, and why is it important?
Lead scoring assigns value to leads based on the type of content they consume. For instance, a lead who consumes bottom-of-funnel content like case studies may have a higher score than someone reading introductory blogs. Lead scoring helps prioritize outreach efforts by identifying the most engaged leads. - How can real user feedback improve my content performance?
Real user feedback helps you understand why something worked or didn’t work. Simple post-engagement surveys or encouraging comments on your blog can provide insights that aren’t visible in the analytics. This feedback helps improve content relevance and address customer pain points effectively. - What is the “content efficiency ratio,” and how do I use it to optimize content production?
The content efficiency ratio measures the ROI of your content by comparing the impact (e.g., leads generated) against the resources invested (e.g., hours spent). Calculate this ratio to identify which content types yield high returns and use this data to prioritize content production that maximizes efficiency. - What are the best elements to A/B test in SaaS content, and why?
In SaaS content, A/B test elements like CTAs, headlines, section orders, and content depth. Different CTAs work better at different funnel stages, while adjustments to content structure can reveal what resonates most with your audience. These insights can then be used to improve other areas like landing pages and emails.