

"SaaS analytics is like a mirror, reflecting both the strengths and weaknesses of your product, enabling you to refine and perfect it."
You know the importance of keeping a keen eye on user behavior. It's critical for driving growth, engagement, and retention. However, navigating the labyrinth of SaaS analytics can be overwhelming. Fear not, dear marketer! We're here to demystify the world of SaaS analytics, so you can better understand how to track and interpret user behavior for data-driven decisions.
Table of Contents
- Why SaaS Analytics Matter
- Getting Started: Key Metrics and KPIs
- The Power of Segmentation
- Diving Deeper: Cohort Analysis
- A/B Testing: The Recipe for Continuous Improvement
- The Must-Have Tools for SaaS Analytics
- Wrapping Up
Why SaaS Analytics Matter
With SaaS, the customer journey is more nuanced than ever before. Gone are the days of one-and-done transactions. Instead, we're ushered into the era of ongoing relationships, subscription models, and the pursuit of delightful user experiences.
To thrive in this brave new world, you need to harness the power of data. SaaS analytics offer critical insights into how your users interact with your product, helping you make smarter, data-driven decisions. When you optimize your product and marketing strategies based on these insights, you can:
- Increase user engagement and satisfaction
- Drive growth through customer acquisition and expansion
- Reduce churn and improve retention
- Optimize pricing and packaging
Alright, buckle up, and let's dive into the metrics and KPIs that matter most.
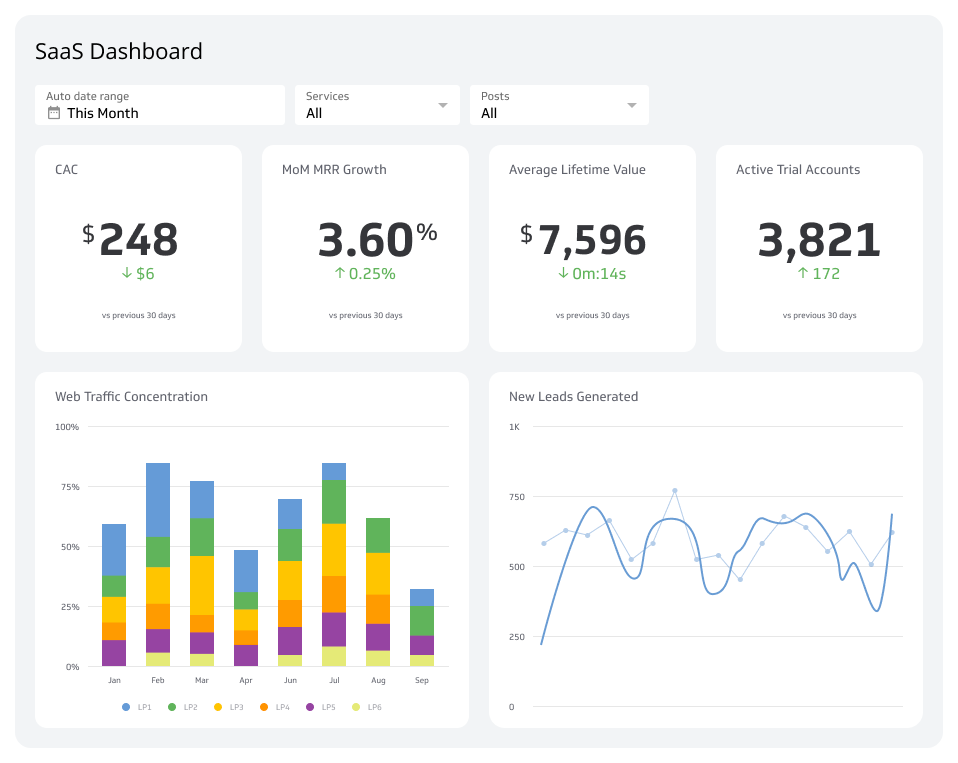
Getting Started: Key Metrics and KPIs
To make sense of the seemingly endless stream of data, it's essential to focus on key metrics and KPIs. Here's a list of the most important ones for SaaS marketers:
- Monthly Recurring Revenue (MRR): The lifeblood of any SaaS business, MRR is the total amount of predictable revenue generated each month from subscriptions.
- Annual Recurring Revenue (ARR): Similar to MRR, but calculated on an annual basis.
- Churn Rate: The percentage of customers who cancel their subscription within a given time period, typically measured monthly or annually.
- Customer Acquisition Cost (CAC): The average amount of money spent to acquire a new customer.
- Customer Lifetime Value (LTV): The predicted net profit that a customer will generate over their lifetime.
- LTV:CAC Ratio: A measure of how efficiently you're acquiring customers. Aim for a ratio of 3:1 or higher.
- Average Revenue Per User (ARPU): The average revenue generated per user, calculated by dividing total revenue by the number of users.
- Net Promoter Score (NPS): A measure of customer satisfaction and loyalty, based on how likely they are to recommend your product to others.
Here's a handy table to help you remember these crucial metrics:
| Metric | Definition | Importance | Action Item |
|---|---|---|---|
| MRR | Monthly Recurring Revenue | Core SaaS revenue metric | Track revenue growth and identify upsell opportunities |
| ARR | Annual Recurring Revenue | Long-term revenue measurement | Evaluate yearly performance and set annual growth goals |
| Churn Rate | Percentage of customers who cancel | Indicator of customer satisfaction and product-market fit | Identify areas for improvement to reduce churn |
| CAC | Customer Acquisition Cost | Measures efficiency of customer acquisition | Optimize marketing strategies to reduce acquisition costs |
| LTV | Customer Lifetime Value | Predicted net profit per customer | Maximize user value through targeted retention efforts |
| LTV:CAC Ratio | LTV to CAC comparison | Gauges balance between customer value and acquisition cost | Strive for a healthy balance to ensure sustainable growth |
| ARPU | Average Revenue Per User | Helps identify pricing and packaging opportunities | Continuously monitor and optimize pricing strategies |
| NPS | Net Promoter Score | Gauge of customer satisfaction and loyalty | Improve product and customer experience to boost satisfaction |
The Power of Segmentation
Segmentation is the art of slicing and dicing your user base into meaningful groups. It's like peeling back the layers of an onion, revealing the hidden patterns and stories lurking beneath the surface.
Why is segmentation important? Well, not all users are created equal. Different user segments may have varying needs, preferences, and behavior patterns. By identifying these segments, you can tailor your marketing and product strategies to cater to their unique characteristics, resulting in better outcomes.
Here are some ways you can segment your users:
- Demographics: Age, gender, location, industry, company size, etc.
- Behavioral: Usage patterns, feature adoption, engagement levels, etc.
- Psychographics: Values, attitudes, interests, etc.
- Technographics: Technology stack, software usage, etc.
- Customer Lifecycle: New users, power users, inactive users, etc.
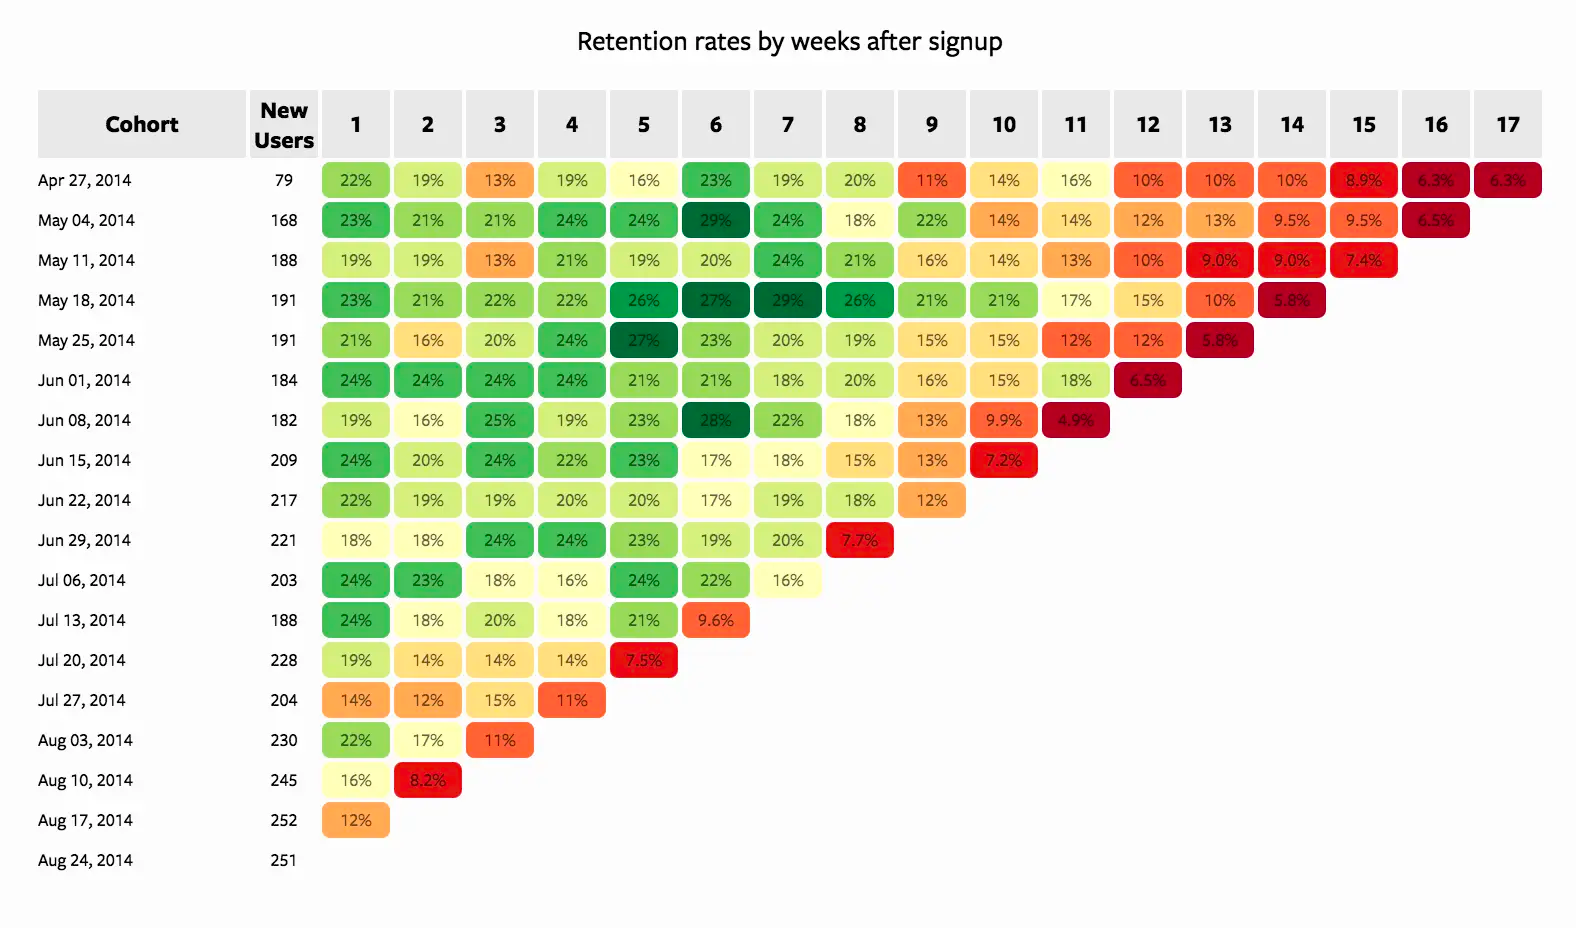
Diving Deeper: Cohort Analysis
Cohort analysis is a nifty technique that groups users based on a shared attribute, typically their sign-up date or first interaction with your product. By tracking these cohorts over time, you can uncover valuable insights into user behavior, retention, and engagement. It's like taking a snapshot of your users' journey, capturing the subtle changes that unfold over time.
Here's how to perform a cohort analysis:
- Define your cohort: Choose the shared attribute that will define your cohort (e.g., sign-up date).
- Select your time frame: Determine the period you want to analyze (e.g., weekly, monthly, quarterly).
- Choose your metrics: Pick the metrics you want to measure within each cohort (e.g., retention rate, revenue, feature usage).
- Analyze and interpret: Examine the data to identify trends, patterns, and anomalies.
Cohort analysis can help you answer questions like:
- How are new users engaging with our product over time?
- Are there differences in retention rates between user cohorts?
- Which features have the most significant impact on user engagement and retention?
- How have recent product updates or marketing campaigns affected user behavior?
A/B Testing: The Recipe for Continuous Improvement
A/B Testing Ideas for SaaS Marketers
| Element to Test | Examples | Potential Impact |
|---|---|---|
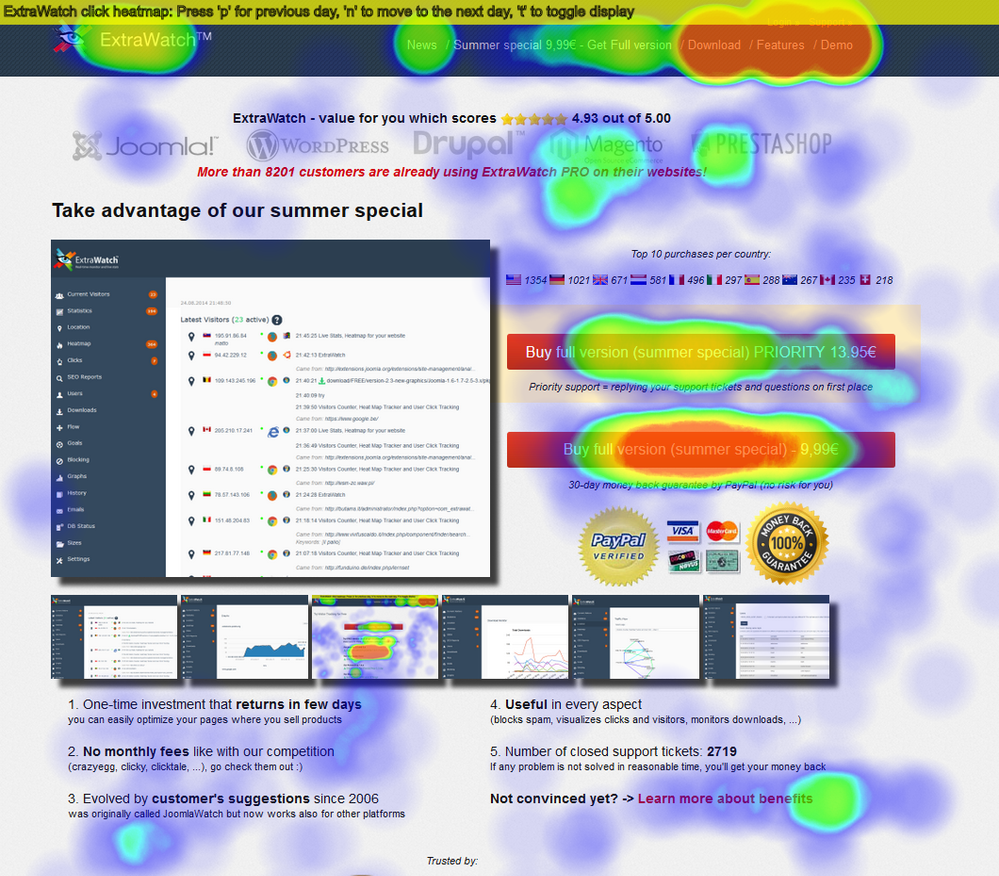
| Call-to-Action (CTA) buttons | Color, size, text, placement | Improve click-through and conversion rates |
| Landing page layout | Headings, images, layout, copy | Enhance user experience and increase conversions |
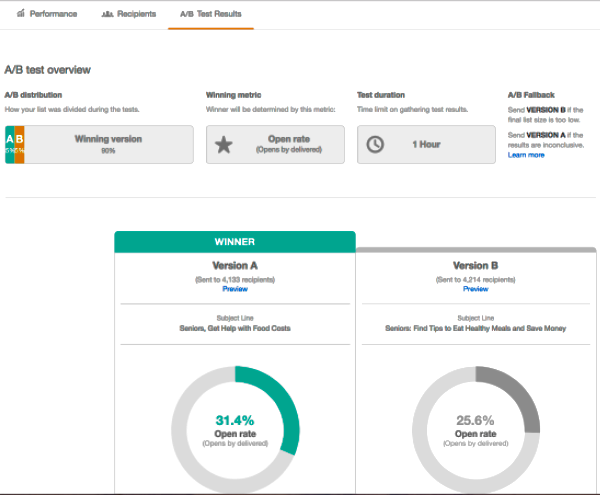
| Email subject lines | Personalization, emojis, urgency | Boost email open rates and engagement |
| In-app messaging | Timing, frequency, content | Enhance user engagement and feature adoption |
| Onboarding process | Length, format, content | Improve user activation and product adoption |
| Pricing and packaging | Tier structures, pricing levels, features included | Optimize revenue and user value |
A/B testing is the process of comparing two versions of a product, feature, or marketing element to determine which performs better. It's like pitting two gladiators against each other in a fierce battle for supremacy. ⚔️
To run a successful A/B test, follow these steps:
- Identify your goal: Determine the primary objective of your test (e.g., improve conversion rates, increase engagement).
- Form a hypothesis: Develop a theory about what changes might lead to better outcomes (e.g., altering the color of a CTA button).
- Create variations: Develop the alternative versions you want to test.
- Split your audience: Randomly assign users to different variations to ensure a fair test.
- Run the test: Launch your experiment and collect data over a predetermined period. 6. Analyze the results: Compare the performance of each variation using statistical analysis to determine the winner.
- Implement and iterate: Apply the winning variation and continuously test new ideas to optimize further.
When running A/B tests, keep these best practices in mind:
- Test one variable at a time: This allows you to pinpoint the specific change that led to the improvement.
- Ensure statistical significance: Make sure your test results are backed by enough data to draw meaningful conclusions.
- Be patient: Give your tests enough time to run and collect data; rushing the process can lead to false conclusions.
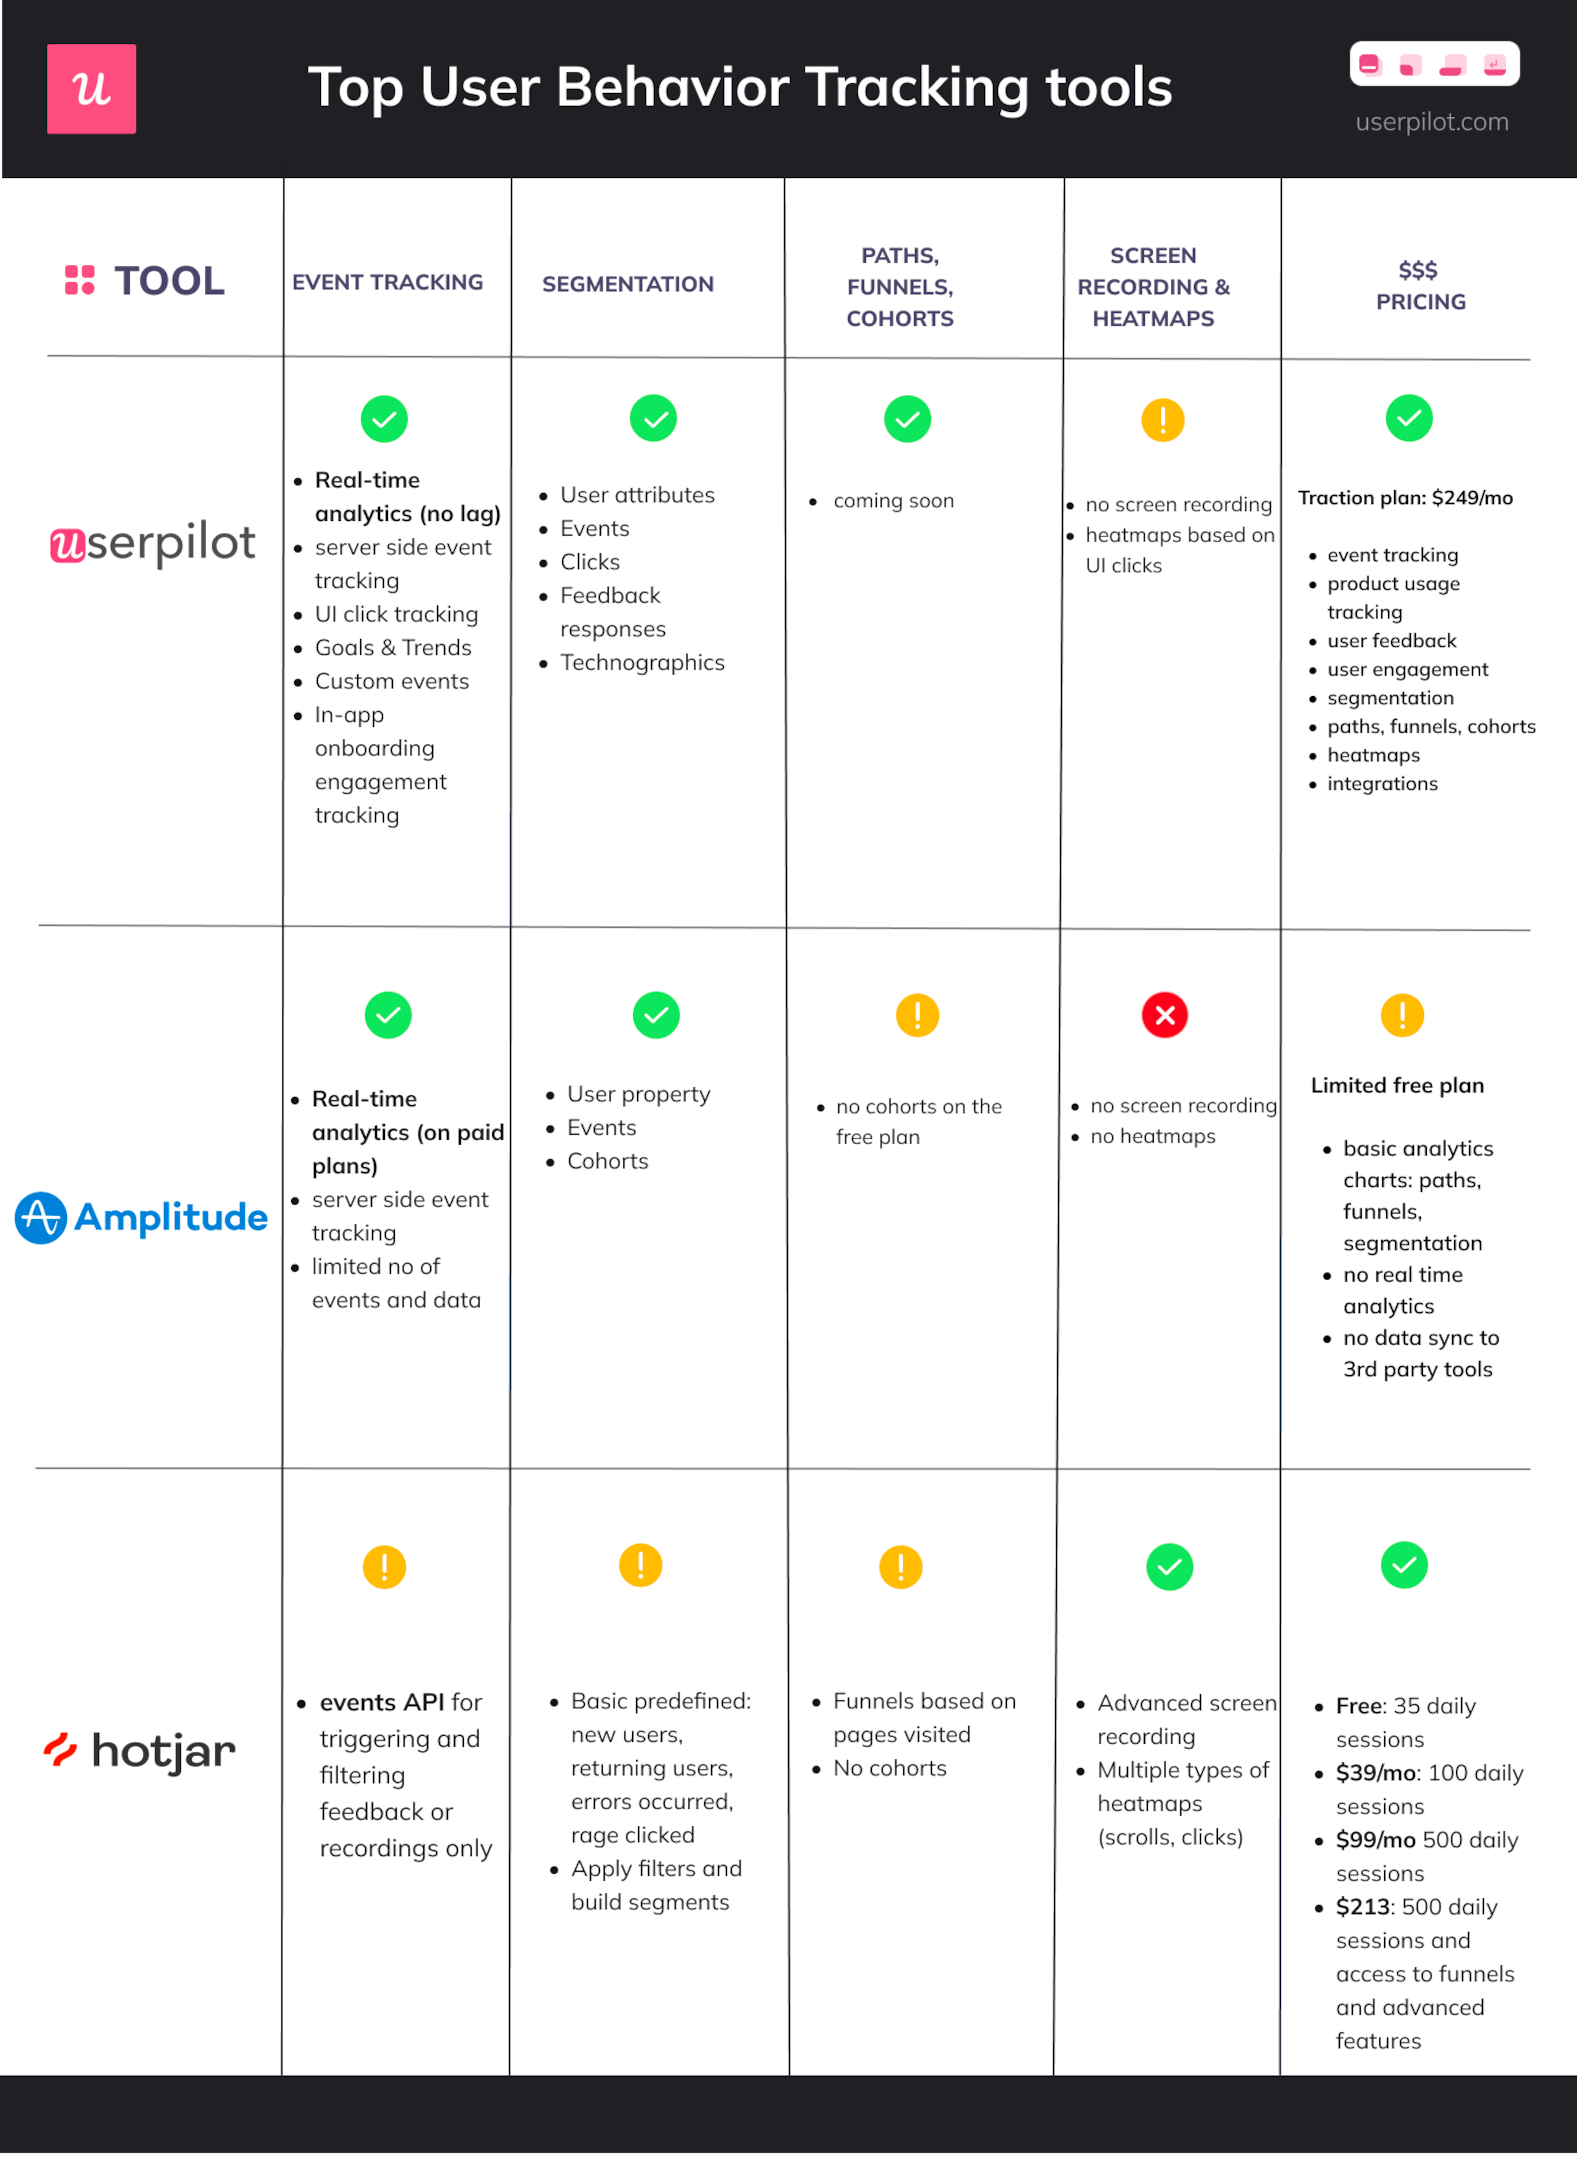
The Must-Have Tools for SaaS Analytics
Popular SaaS Analytics Tools Comparison
| Tool | Key Features | Best For | Pricing |
|---|---|---|---|
| Google Analytics | Web analytics, traffic sources, conversions | Basic web analytics needs | Free |
| Mixpanel | Real-time insights, funnel analysis, cohort analysis | Advanced user behavior analysis | Free tier available, paid plans from $89/month |
| Amplitude | Behavioral cohorts, predictive analytics, path analysis | Deep user behavior insights | Free tier available, paid plans from $995/month |
| Heap | Codeless analytics, automatic data capture, event visualization | Easy-to-use analytics with minimal setup | Custom pricing |
| Segment | Data unification, seamless tool integration, API access | Managing and unifying customer data | Free tier available, paid plans from $120/month |
| Optimizely | A/B testing, multivariate testing, personalization | Running experiments and optimizing user experience | Custom pricing |
With a plethora of SaaS analytics tools available, it's essential to pick the ones that best suit your needs. Here's a curated list of must-have tools for SaaS marketers:
- Google Analytics: A free, comprehensive web analytics tool that tracks user behavior, traffic sources, and conversions.
- Mixpanel: A powerful user analytics platform that offers real-time insights, funnel analysis, cohort analysis, and more.
- Amplitude: Another robust user analytics tool, with advanced features like behavioral cohorts and predictive analytics.
- Heap: A codeless analytics solution that automatically captures all user interactions, making it easy to analyze and visualize data.
- Segment: A customer data platform that unifies data from various sources, enabling seamless integration with other analytics tools.
- Optimizely: A popular A/B testing platform that simplifies the process of running experiments and analyzing results.
When selecting your tools, remember that the key is to find the ones that integrate well with your existing technology stack, align with your goals, and offer the right balance of features and ease-of-use.
Wrapping Up
As we've journeyed through the world of SaaS analytics, we've demystified the essentials of tracking and interpreting user behavior for data-driven decisions. Armed with this knowledge, you're now ready to unleash the full potential of your SaaS marketing efforts.
Let's recap the key takeaways:
- Focus on key metrics and KPIs: Keep a close eye on MRR, ARR, Churn Rate, CAC, LTV, LTV:CAC Ratio, ARPU, and NPS.
- Leverage segmentation: Understand your users better by dividing them into meaningful groups based on demographics, behavior, psychographics, technographics, or customer lifecycle.
- Employ cohort analysis: Group users based on shared attributes and track their behavior over time to uncover valuable insights.
- Run A/B tests: Continuously optimize your product and marketing strategies by experimenting with different variations and analyzing the results.
- Choose the right tools: Select analytics tools that align with your needs and integrate well with your existing technology stack.
Now, go forth and conquer the world of SaaS analytics! May your data-driven decisions lead to unparalleled success.
FAQ
1. How do I choose the right SaaS analytics tool for my business?
When selecting a SaaS analytics tool, consider the following factors:
- Features: Ensure the tool offers the features and functionality required for your specific needs (e.g., cohort analysis, real-time insights, A/B testing).
- Ease of use: Choose a tool that is user-friendly and easy to navigate for your team.
- Integration: Check whether the tool integrates seamlessly with your existing technology stack and other analytics tools.
- Pricing: Evaluate the tool's pricing structure and ensure it fits within your budget.
- Scalability: Consider whether the tool can grow with your business and handle increased data volume and complexity as needed.
2. What is the difference between MRR and ARR?
MRR (Monthly Recurring Revenue) is a core SaaS revenue metric that measures the total recurring revenue generated in a month. ARR (Annual Recurring Revenue) is a long-term revenue measurement that calculates the total recurring revenue generated in a year.
MRR provides a snapshot of your monthly revenue performance, while ARR offers a broader perspective on your yearly performance, helping you set annual growth goals and evaluate your overall business health.
3. How can I reduce churn in my SaaS business?
To reduce churn, consider the following strategies:
- Improve onboarding: Ensure new users have a smooth and informative onboarding experience to increase the likelihood of successful product adoption.
- Enhance customer support: Provide exceptional customer service to address user concerns and resolve issues promptly.
- Gather feedback: Regularly collect user feedback to understand their needs, preferences, and pain points, then address these issues through product updates or improvements.
- Monitor usage patterns: Track user engagement and feature adoption to identify potential areas for improvement.
- Implement proactive retention efforts: Identify at-risk users and implement targeted retention campaigns to encourage continued use of your product.
4. How do I calculate LTV:CAC Ratio and what is a good benchmark?
The LTV:CAC Ratio compares the Customer Lifetime Value (LTV) to the Customer Acquisition Cost (CAC). It is calculated as follows:
LTV:CAC Ratio = LTV / CAC
A good benchmark for LTV:CAC Ratio is typically around 3:1, which means that the value of a customer should be approximately three times the cost of acquiring them. However, this benchmark can vary depending on the industry, market, and business model.
5. How do I know if my A/B test results are statistically significant?
Statistical significance is achieved when your test results show a clear, consistent difference between the variations, with a low probability of the results occurring due to random chance. To determine statistical significance, you can use a significance calculator or an A/B testing tool that provides built-in significance calculations.
As a general rule, aim for a significance level of at least 95%, which means that you can be 95% confident that the observed difference between the variations is due to the tested change and not random chance.
6. What are the benefits of using segmentation in my SaaS marketing strategy?
Segmentation offers several benefits, including:
- Personalized marketing: Tailor your marketing campaigns and messaging to better resonate with each user segment, increasing engagement and conversion rates.
- Improved product development: Understand the unique needs and preferences of different user segments to inform product features and improvements.
- Increased customer satisfaction: Cater to the specific requirements of each user segment, resulting in a more satisfying user experience and higher retention rates.
- Informed decision-making: Make data-driven decisions based on insights gained from analyzing the behavior and preferences of different user segments.
7. How can cohort analysis help me improve my SaaS product?
Cohort analysis can provide valuable insights into user behavior over time, helping you identify trends, patterns, and anomalies. By analyzing cohorts, you can:
- Understand feature adoption: Determine which features are most popular among different cohorts and focus on enhancing these features or developing complementary ones.
- Identify potential issues: Uncover areas where users may be struggling or disengaging, then address these issues through product improvements or targeted support.
- Optimize onboarding: Analyze how different cohorts respond to your onboarding process and make data-driven improvements to enhance user activation and product adoption.
- Measure the impact of changes: Assess the impact of product updates, marketing campaigns, or other changes on user behavior and satisfaction.
8. How long should I run an A/B test?
The duration of an A/B test depends on several factors, including your desired level of statistical significance, the amount of traffic your website or app receives, and the effect size you're trying to detect.
As a general guideline, aim to run your test for at least one full business cycle (e.g., one week) to account for any fluctuations in user behavior. Additionally, ensure that you've collected enough data to achieve statistical significance and make meaningful conclusions.
Keep in mind that running a test for too short a duration may lead to false conclusions, while running it for too long may waste resources and delay the implementation of winning variations.
9. How do I ensure that my team is aligned on the importance of SaaS analytics?
To align your team on the importance of SaaS analytics, consider the following strategies:
- Educate: Provide training and resources to help your team understand the value of SaaS analytics and its role in driving growth and retention.
- Communicate: Regularly share analytics insights, results, and success stories with your team to demonstrate the impact of data-driven decision-making.
- Collaborate: Involve team members in the analytics process, from defining key metrics and KPIs to implementing tracking mechanisms and interpreting results.
- Celebrate: Recognize and reward team members who actively use analytics insights to drive improvements and achieve business objectives.
10. Can I use multiple SaaS analytics tools together?
Yes, using multiple SaaS analytics tools together can provide a more comprehensive view of your user behavior and performance metrics. To do this effectively:
- Integrate your tools: Ensure that your chosen analytics tools integrate seamlessly with each other and your existing technology stack, allowing data to flow smoothly between systems.
- Centralize your data: Use a customer data platform (CDP) like Segment to unify your data from various sources and provide a single, consistent view of your user behavior.
- Avoid data silos: Encourage cross-functional collaboration and data sharing among your team members to ensure that insights are utilized across your organization.
By leveraging multiple analytics tools in tandem, you can gain a deeper understanding of your users and make more informed, data-driven decisions to drive growth and success in your SaaS business.